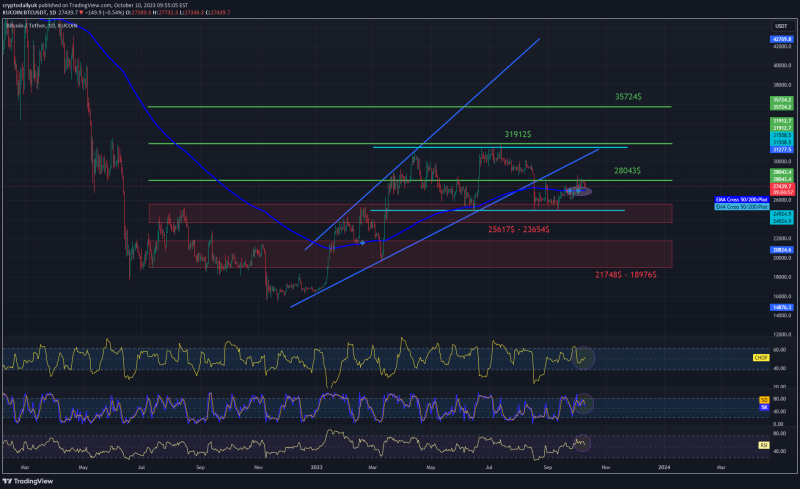
Hello everyone, I invite you to Tuesday’s review of the current situation on BTC in the USDT pair, taking into account the one-day time frame. First, we will use blue lines to mark the upward trend channel from which, as you can see, the price has come out at the bottom. Therefore, at this point, you need to determine a new side trend channel in which the price is currently moving.
When we turn on the EMA Cross 200, we can see that the BTC price has gone above the blue moving average line of 200, and we are currently struggling to stay in the uptrend.
Now we can move on to marking support areas in case the correction deepens. And here, first of all, it is worth marking the support zone from $25,617 to $23,654, from which the price has already bounced several times, but when we fall below this zone, we may see a drop to the vicinity of the second, very strong support zone from $21,748 to $18,976.
Looking the other way, we can determine resistance locations in a similar way using the Fib Retracement tool. And here you can see that the price is again approaching the resistance at the level of $28,043, only when we go up above it, we will see an attempt to attack the very strong resistance at the level of $31,912, which is also the upper limit of the currently ongoing sideways trend channel, then a path will open up direction $35,724.
Please pay attention to the CHOP index, which indicates that the energy is slowly starting to grow, on the STOCH indicator we are near the upper limit, which may result in a greater recovery, but on the RSI indicator we are back near the middle of the range and considering that we have not touched the upper limit, we can see a new attempt at growth after the current recovery.

