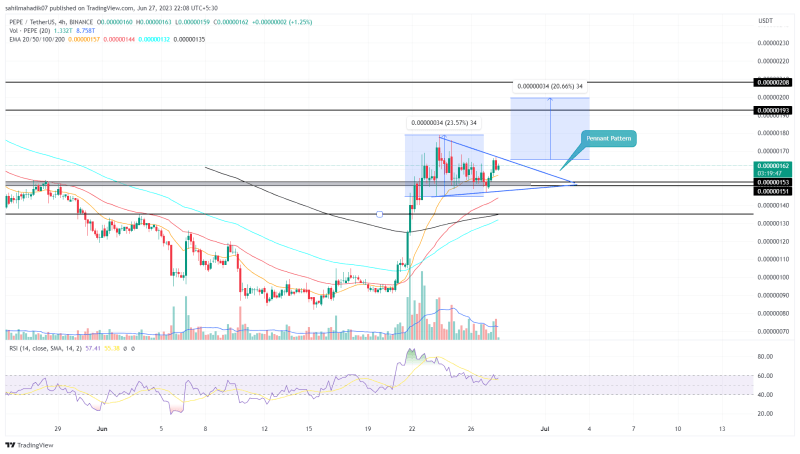
The fast-recovering Pepecoin price takes a breather above $0.00000151 support. This slight detour shows alternate green and red candles indicating uncertainty among market participants. However, a closer look at the lower time frame chart revealed this consolidation as the formation of a famous bullish continuation pattern called pennant. Here’s how this pattern could influence the near further growth of this frog-theme memecoin.
Also Read: Pepe Coin Skyrockets 40%, Will SHIB, DOGE, and FLOKI Follow?
Pepecoin Price Daily Chart
- The area between the triangle structure for the pennant pattern can be considered a no-trading zone.
- The current correction phase stays above the 32.6% Fibonacci retracement level, indicating the overall trend remains bullish
- The 24-hour trading volume in the Pepecoin coin is $241.5 Million, indicating a 0.5 % gain.

Source-Tradingview
In the 4-hour time frame chart, Pepecoin shows the formation of a pennant pattern. This pattern has emerged as the buyers would need a short break before resuming the prevailing uptrend.
This consolidation will potentially replenish the exhausted bullish momentum and absorb the build-up selling pressure. By the press time, the PEPE price trades at $0.00000161 and continues to resonate within the triangle structure of this pattern.
The most common outlook of this pattern would be a breakout above the overhead trendline and offer new entry opportunities to buyers. The potential breakout could boost buying pressure and push the price to $0.00000193, followed by $0.00000208.
Can Pepecoin Price Fall Back to $0.00000135?
In theory, the pennant pattern offers a brief break period to recuperate the bullish momentum. Therefore, after the aggressive rally last week, the PEPE price is likely to remain sideways for a couple of days before reinitiating the bullish rally. However, in an unlikely scenario, a breakdown below the support trendline will undermine the bullish thesis and may plunge the coin price to $0.00000135.
- Relative Strength Index: The daily RSI slope value sustaining above the 50% mark indicates the bullish momentum is active.
- Exponential Moving Average: The 4-hour EMAs(50 and 100) catching up to the bullish trend indicate the coin price is getting stabilized probably for the higher rally.

