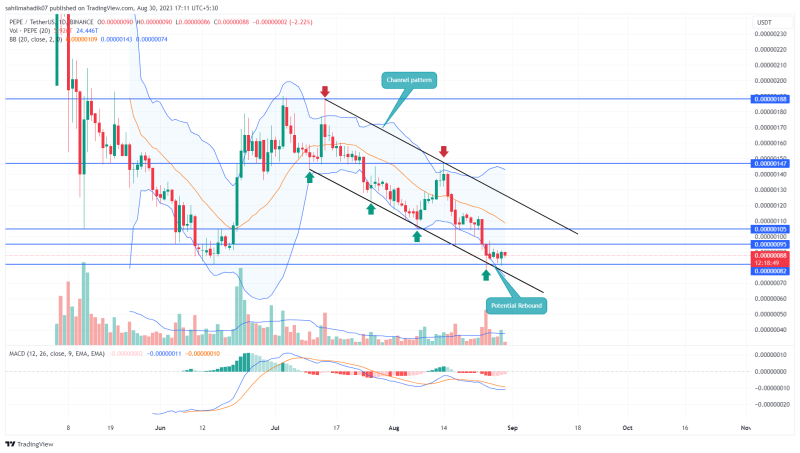
On August 29th, the crypto market witnessed a sudden surge in buying pressure as BTC price pumped to the federal court verdict favoring Greyscale investment over US SEC on Bitcoin ETF. As a result, the PEPE price showed another rebound attempt from $0.0000082 support to trigger a fresh recovery. Is this bounce enough to defy prevailing bearish sentiment?
Also Read: Polkadot (DOT) And Pepe Coin (PEPE) See Declines, While Everlodge (ELDG) Rises As The New Crypto King
Pepe Coin Daily Chart: Key Points
- The Pepe coin price may continue sideways until the rectangle pattern is intact.
- A bullish breakout from $0.00000095 will set the prices for a 20% upswing
- The 24-hour trading volume in the Pepe coin is $130 Million, indicating a 92% gain.

Source- Trading
The Pepe coin price has been trading sideways for the past five days reflecting no initiation from buyers or sellers for trend control. Interestingly this consolidation is confined within the range of August 17th candle($0.00000095 high and $0.00000075 low).
With the recent bounce mentioned above, the coin price trades within the rectangle range indicate the buyer would need more momentum to trigger a fresh recovery. By the press time, the PEPE price traded at $0.00000089 with an intraday loss of 1.11%.
If the bullish momentum rises, the buyers may breach the $0.00000095 resistance. The post-breakout rally would surge the prices 20% higher to hit the resistance trendline of the channel pattern.
Is PEPE Price Ready to Start New Recovery?
With the anticipated upswing, the PEPE price would hit the upper trendline of the channel pattern which in its history has offered significant supply pressure in the market. Therefore, until the channel pattern is intact, the short-term trendline of this memecoin will remain down.
A bullish breakout from the resistance trendline will signal a better confirmation of sustained recovery.
- Bollinger Band: The lower band of the Bollinger band indicator facing the downside reflects the bearish momentum is intact.
- Moving Average Convergence Divergence: A potential bullish crossover between the MACD(blue) and signal(orange) could offer an additional edge for a bullish recovery.

