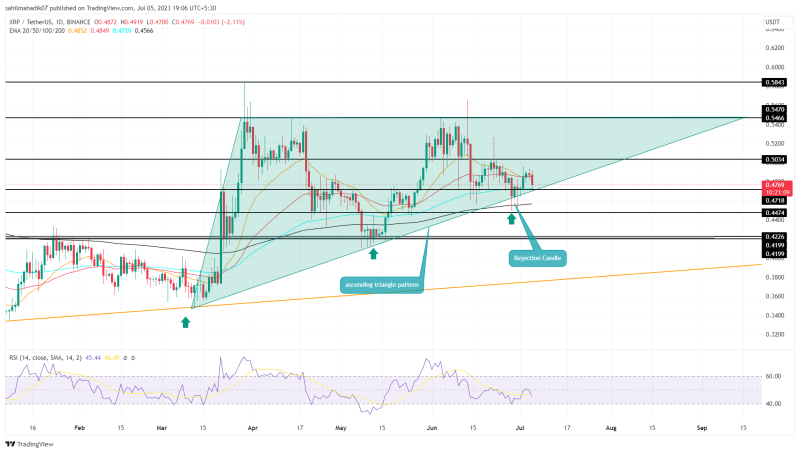
While the broader market sentiment shows a pause in its recovery phase, the XRP price continues to waver above a support trendline of ascending triangle pattern. Though this uptrend continuation setup maintains a positive trend in the long run, the buyer’s inability to rise from the rising trendline reflects weakness in underlying bullish momentum. Thus, traders must remain cautious and follow strict risk management if the coin price breaches dynamic support.
Also Read: XRP Lawsuit: Crypto Lawyer Clarifies Stance on Summary Judgement Timeline
XRP Price Daily Chart:
- A retest to the support trendline provides buyers an opportunity to reaccumulate
- A potential bullish reversal could set the XRP price for a 15% upswing
- The intraday trading volume in the XRP is $891.2 Million, indicating a 4.3% loss.

Source- Tradingview
With an intraday loss of 2.3%, the XRP price makes a comeback to the triangle’s pattern support trendline. In theory, this retest should recuperate the bullish momentum and assist buyers to prolong the upward rally.
However, for the past three weeks, the coin price has been hovering above the support trendline but were able to make significant growth. Thus, the buyers’ failure to reclaim lost ground indicates a lack of commitment and the possibility of considerable correction.
A breakdown below the support trendline will provide sellers with a strong barrier to pressure the XRP price to a lower level. The rising supply pressure could tumble the price 11% down to reach the $0.4 mark.
Can XRP Price Breach $0.55?
For the XRP price to maintain a bullish trend, the buyers need to protect the ascending triangle pattern. The constant support from the rising trendline could gradually bolster the buyers to revisit the $0.55 neckline. Under the influence of this pattern, the XRP price may also regain enough momentum, to break the $0.55 as a sign of trend reversal
- Relative Strength Index: The daily-RSI slope below 50% indicates the sellers have an upper hand.
- Exponential Moving Average: The flattish EMAs(20, 50, 100, and 200) reflect neutral sentiment for the market trend.

