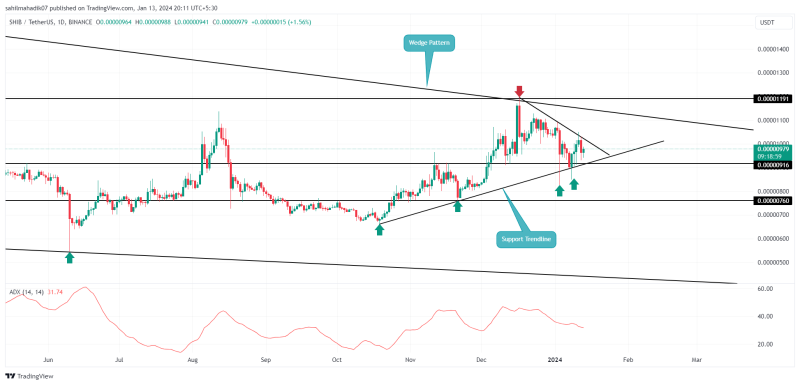
Shiba Inu Price Prediction: Despite the growing enthusiasm for spot Bitcoin ETFs, Shiba Inu, the second-largest meme cryptocurrency, has experienced a downward trend over recent months. The coin has witnessed an 18% decrease from its previous peak of $0.00001195, currently trading at around $0.00000981. Nevertheless, this downward movement remains within the acceptable limits as per the Fibonacci retracement tool. During this period, there has been a notable uptick in acquisitions by whale investors, suggesting a robust possibility of a bullish reversal shortly.
Can SHIB Price Reclaim $0.00001 Mark?
- A rising trendline accentuates the SHIB price continues to witness demand pressure at market dips
- A bullish breakout from the overhead trendline will trigger a directional rally
- The 24-hour trading volume on the Shiba Inu is at $186 Million with a 6.6% loss.

Shiba Inu Price Prediction| TradingView Chart
A look at the daily time frame chart shows the Shiba Inu price has taken strict note of two converging trendlines. The first one has acted as a support trendline for nearly three weeks, offering traders dynamic support during the market correction.
On the other hand, a downsloping trendline is leading the current correction trend in SHIB price, restricting traders from higher recovery, However, a recent X(former Twitter) post from -on-chain data analyst Lookonchain reveals that a newly created whale wallet has acquired a staggering 136.86 billion SHIB tokens, valued at approximately $1.38 million.
This significant accumulation occurred soon after the SHIB community undertook a massive token burn, eliminating 9.35 billion tokens and causing the burn rate to surge by an astonishing 28,600%. Lookonchain’s data further indicates that over the last month, four major investors have collectively purchased 2.39 trillion SHIB tokens from the Binance cryptocurrency exchange.
This heavy accumulation despite a correction phase indicates a higher potential for the SHIB price to rebound higher.
On January 9th, the SHIB price rebounded from the lower trendline which led to an 8.5% increase. If the rising price gives a bullish breakout from the overhead resistance trendline, the buyers would get an additional confirmation of recovery.
The post-breakout rally would surge the SHIB price by 16% from the current trading price of $0.00000978 and rechallenge the upper boundary of the wedge pattern. A breakout beyond this barrier would signal a change in the market dynamic and bolster a rally to $0.000018.
Key Support Level to Watch
While the current market outlook for Shiba Inu price seems bullish, the ongoing rumor of spot Bitcoin ETF being a sell-the-news event has created market-wide uncertainty. Until the lower trendline is intact, this memecoin may prolong its current recovery. However, a breakdown below would accelerate the selling pressure and may trigger a new correction in SHIB price.
- Average Directional Index: The high-value ADX slope indicates the Shiba Inu price would need prolonged correction to recover the exhausted bullish momentum.
- Bollinger Band: The flattish boundaries of the Bollinger Band indicator project a lack of momentum in buying and selling pressure.

