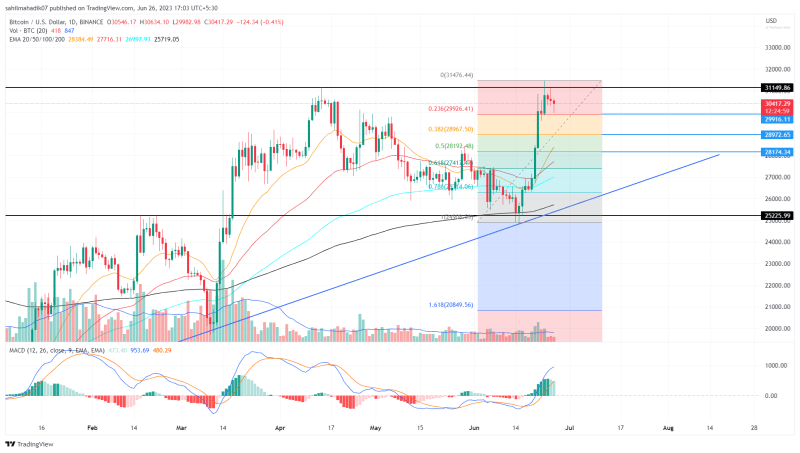
With the recovery rally, the Bitcoin price marked a new high of the year 2023 at $31475. However, the buyers were unable to breach the swing top resistance of $31150 indicating the overhead supply is still active. Anyhow, after the recent directional rally, a minor pullback is advisable for the largest cryptocurrency to recuperate the exhausted bullish momentum.
Also Read: Bitcoin On-Chain Data Flashes Rare Bullish Signal
Bitcoin Price Daily Chart:
- A minor correction helps stabilize the market by dampening excessive speculation and preventing the formation of an unsustainable price bubble
- A pullback to $29000 or $28180 would be considered healthy for long-term growth in Bitcoin
- The intraday trading volume in Bitcoin is $13.9 billion, indicating a 5.2% gain.

(Source: Tradingview)
In just two weeks, the Bitcoin price witnessed a remarkable surge of 25%, starting from a local support level of $25180 and reaching the March 2023 peak of $31150. However, the daily chart started projecting rejection candles at the aforementioned resistance indicating the selling pressure at this barrier is intact.
Thus, a minor pullback has tumbled the BTC price by 3% to nearly test the 23.6% Fibonacci retracement level at $30000. By the press time, the Bitcoin price trades at the $30343 mark, with an intraday loss of 0.61%.
If the overhead supply pressure persists, the coin price could witness a longer correction to $29000(32.8% FIB), or $28200(50% FIB), before resuming the prior recovery.
Will Bitcoin Price Surpass $31150?
After an aggressive rally in the past two weeks, the Bitcoin price will likely take a breather with a minor consolidation or pullback. As per the aforementioned Fibonacci tool, the $30000, $29000, and $28180 stand as a strong support to replenish the bullish momentum. If the potential correction sustains above $28180, the coin price will likely surpass the $31150 peak with resumed recovery.
- Exponential Moving Average: The daily EMAs(20, 50, 100, and 200) left far behind in the recent rally indicate a minor retracement is needed to stabilize price action.
- Moving Average Convergence Divergence: The wide gap between MACD(blue) and the signal(orange) line in a bullish alignment keeps the overall trend optimistic,

