Shiba Inu Price Prediction: The second-largest meme coin Shiba inu displays a bullish week and continues to prolong its recovery phase. From the annual low of $0.00000543 the coin price rallied to presently trade $0.000011, giving a YTD growth of 36%. Moreover, the ongoing recovery phase presents a new breakout entry.
Also Read: Shiba Inu News: Whale Moves 4 Tln SHIB, Shytoshi Kusama Spotlights LEASH Listing
Is SHIB Heading to $0.000015?
- An ascending trendline prevents the SHIB price from major correction.
- A bullish breakout from the wedge pattern would signal a better confirmation of a bull run
- Shiba Inu is at $214 Million with a 39% loss.

Shiba Inu Price Prediction| TradingView Chart
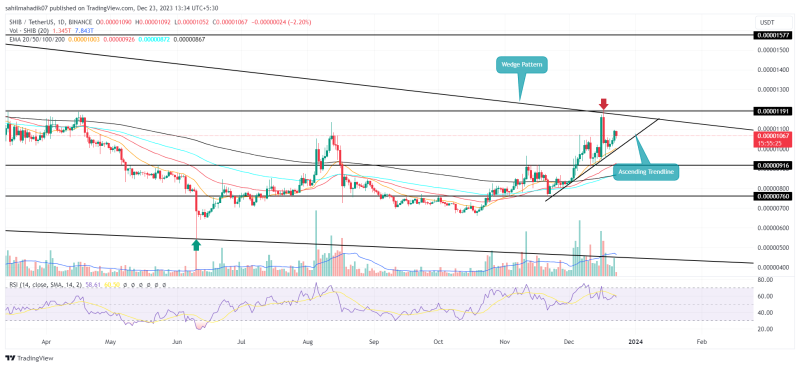
Maintaining an overall uptrend, the Shiba Inu price approaches the overhead resistance of the wedge pattern. The ongoing uptrend creates an ascending trend line which reflects the ongoing short-term recovery phase.
The sharp rise in the trading volume supports the possibility of a bullish breakout. As of now, the SHIB price trades at $0.0000011 and is trying to sustain the trend momentum.
As 2024 approaches, the cryptocurrency market is optimistic about the potential approval of a Bitcoin spot ETF, positively influencing various cryptocurrencies, including Shiba Inu (SHIB). Amidst this bullish sentiment, SHIB’s price has seen a rise for four consecutive days, reflecting increased investor confidence.
Nevertheless, the overall bullish trend is intact, and a possible bounce back from the ascending support trendline by 15.56% to challenge above the overhead trendline.
The post-breakout rally could lead a 6-8% Jump, with the intent of challenging the resistance at $0.00001187.
Is SHIB Ready For Uptrend?

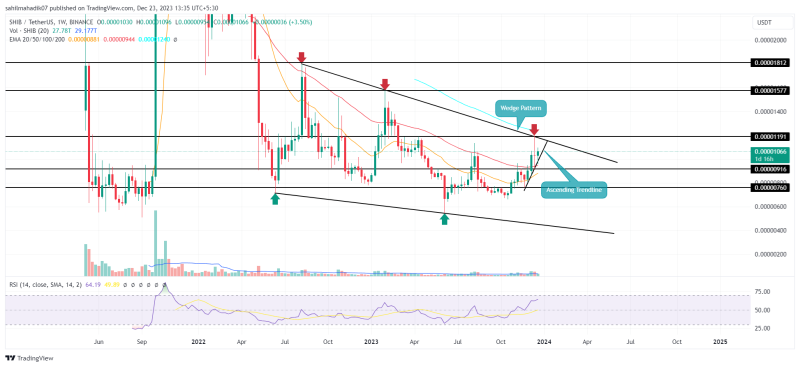
While the short-term trend displays a bullish journey for the meme coin, the longer picture displays a falling wedge in action. Currently, the bullish week for meme coin accounts for a 15.3% recovery and bolsters the breakout theory. However, the multi-contact resistance trendline will prove a formidable obstacle. An upside breakout from the overhead resistance will be a better signal for trend change, potentially chasing the $0.0000157 mark followed by $0.000018.
- Relative Strength Index: The daily RSI slope above 60% reflects the bullish sentiment is intact.
- Exponential Moving Average: The coin price trading below 100-and-200-day EMA indicates the long-term trend is bearish.

