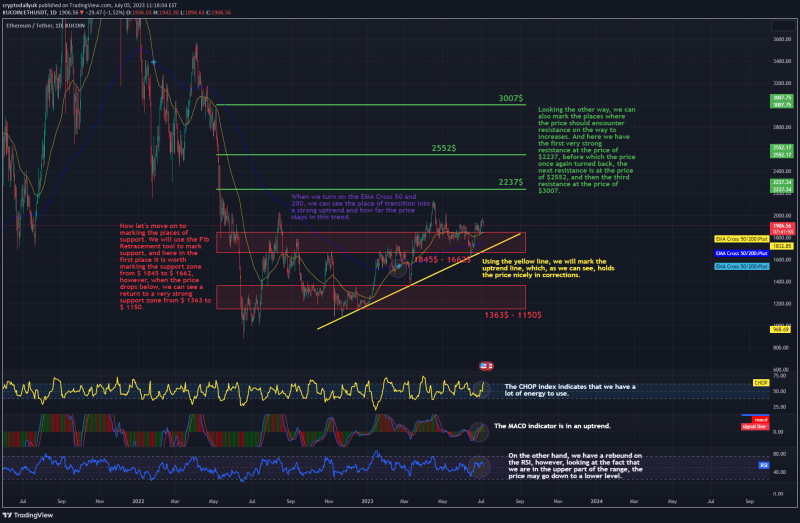
Hello everyone, I invite you to review the chart of ETH in pair to USDT, taking into account the one-day interval. Using the yellow line, we will mark the uptrend line, which, as we can see, holds the price nicely in corrections.
Now let’s move on to marking the places of support. We will use the Fib Retracement tool to mark support, and here in the first place it is worth marking the support zone from $ 1845 to $ 1662, however, when the price drops below, we can see a return to a very strong support zone from $ 1363 to $ 1150.
Looking the other way, we can also mark the places where the price should encounter resistance on the way to increases. And here we have the first very strong resistance at the price of $2237, before which the price once again turned back, the next resistance is at the price of $2552, and then the third resistance at the price of $3007.
When we turn on the EMA Cross 50 and 200, we can see the place of transition into a strong uptrend and how far the price stays in this trend.
The CHOP index indicates that we have a lot of energy to use. The MACD indicator is in an uptrend. On the other hand, we have a rebound on the RSI, however, looking at the fact that we are in the upper part of the range, the price may go down to a lower level.

