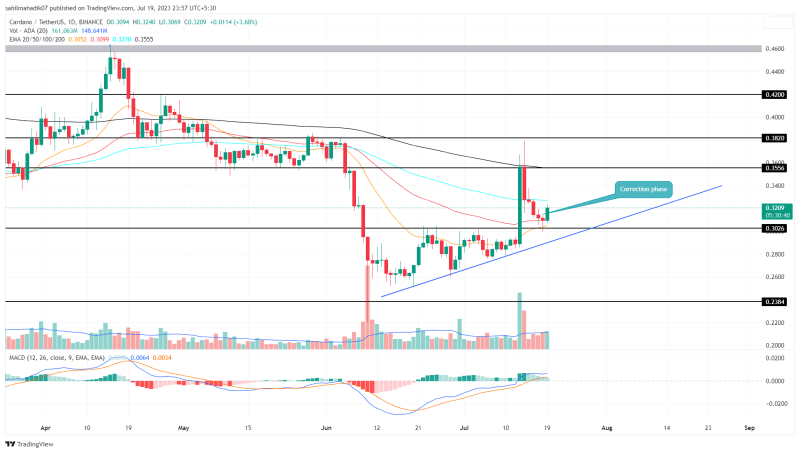
Cardano Price Analysis: While the market leader Bitcoin and Ethereum creates uncertainty with their sideways action, the Cardano coin price maintained its recovery rally under the influence of the rising trendline. A recent correction in this altcoin provides another dip opportunity to hope on the current recovery rally. Can the post-correction rally surge the seventh-largest cryptocurrency back above $0.35?
Also Read: Cardano Price Analysis: Will $0.3 Support Hold Amidst Market Volatility?
Cardano Price Daily Chart
- An ascending trendline carries the current recovery in ADA price.
- A morning star candle formation at combined support of $0.3 and ascending trendline reflect a suitable possibility of bullish reversal.
- The intraday trading volume in the ADA coin is $367.6 Million, indicating a 22.2% gain.

Source- Tradingview
Following a drastic fall in Cardano’s market value in June 2023, the ADA prices stabilized close to the $0.25 support level. With a V-shaped recovery and overhead resistance of $0.30, the ADA price action formed an ascending triangle pattern.
With the recent surge of 23% triggered by Ripple’s partial win, the ADA price rose above $0.30. However, the sentiments furled rally failed to overcome the excessive selling pressure at $0.38 and gave a closing below $0.35.
With the prolonged selling after the higher price rejection at $0.38, the coin price retests the broken $0.30 horizontal level.
At the time of writing this article, the ADA coin trades at $0.317 making an intraday gain of 2.58%.

1 ADA to USD = $0.3171332 -1.94% (24h) TRADE

ADA

USD
Can ADA Price Fall Back to $0.24?
With ADA price action displaying lower price rejection close to the $0.30 horizontal level, the chances of a post-retest reversal are increasing. With a bullish reversal, the Cardano price might break above $0.35 to re-challenge the overhead supply at $0.38.
However, the ADA price must avoid giving a closing below $0.30 to sustain the bullish outlook. In case the ADA price falls below $0.30, the market value might plunge to $0.24.
- Moving Average Convergence Divergence: The converging MACD(blue) and Signal(orange) lines with intent for negative crossover indicate losing bullish momentum
- Exponential Moving Average: The 20-and-50-day EMAs wavering near the $0.3 support offers additional support to market bulls.


