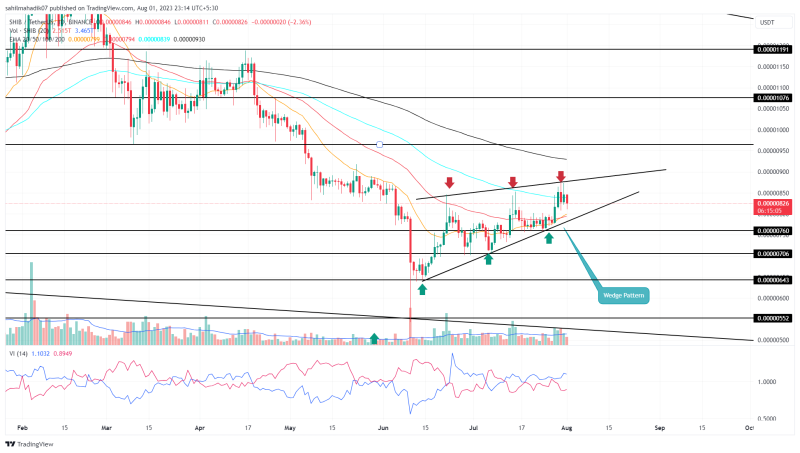
Defying the increasing bearishness in the crypto market, the Shiba Inu price shows a bullish recovery with new sets of higher highs and higher lows. However, the daily time frame chart shows this recovery is following a rising wedge pattern, lead by two converging trendlines. In theory, this pattern is a downtrend continuation setup indicating the Dog-themed memecoin is poised for a significant correction.
Also Read: New Cryptocurrency ‘Shibie Coin’ Launches Token Presale, Merging Barbie With Shiba Inu
Shiba Inu Price Daily Chart:
- A bullish crossover between the 20-and-50-day EMAs may increase the buying pressure in the Shiba Inu coin.
- A bullish breakout from the overhead trendline could set the SHIB price for a 20% rally.
- The intraday trading volume of the Shiba Inu coin is $141. Million, showing an 18% loss.

Source- Tradingview
Amid the ongoing downfall in the largest cryptocurrency Bitcoin, the Shiba Inu price witnessed overhead supply at chart pattern resistance trendline near $0.00000875. The daily candles with long wicks on the upside indicate the sellers continue to defend the upper trendline.
As of now, the SHIB price trades at $0.00000824 and showcases an intraday loss of 2.5%. If the bearish momentum persists, the SHIB price could witness a bearish reversal within the wedge pattern and plunge 3% to revisit the lower trend.
Under the influence of this chart setup, the coin price is likely to break the lower support trendline as an indication of a downtrend continuation. The potential breakdown with daily candle closing will intensify the supply pressure and plummet the SHIB price to $0.0000076, followed by $0.000007 and $0.00000643.
Will SHIB Price Rally $0.00001?
In case the market sentiment shows improvement in the coming days, the coin holders may experience increased accumulation at the support trendline. considering an optimistic scenario, a bullish breakout from the overhead trendline will invalidate the bearish thesis. the post- breakout rally could surge the prices 20 higher to hit $0.00001076.
- Vortex indicator: A bullish crossover state within the VI+(blue) and VI-(Orange) indicates the current recovery sentiment is intact
- Exponential Moving Average- the Shiba Inu price trading below the 200 EMA indicates the overall market trend is bearish

