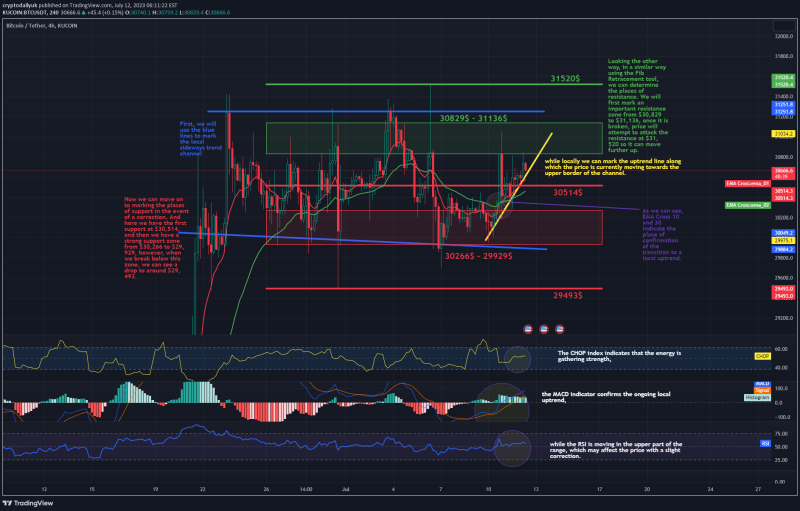
Hello everyone, I invite you to check the current situation on the BTC pair to USDT, taking into account the four-hour interval. First, we will use the blue lines to mark the local sideways trend channel, while locally we can mark the uptrend line along which the price is currently moving towards the upper border of the channel.
Now we can move on to marking the places of support in the event of a correction. And here we have the first support at $30,514, and then we have a strong support zone from $30,266 to $29,929, however, when we break below this zone, we can see a drop to around $29,493.
Looking the other way, in a similar way using the Fib Retracement tool, we can determine the places of resistance. We will first mark an important resistance zone from $30,829 to $31,136, once it is broken, price will attempt to attack the resistance at $31,520 so it can move further up.
As we can see, EMA Cross 10 and 30 indicate the place of confirmation of the transition to a local uptrend.
The CHOP index indicates that the energy is gathering strength, the MACD indicator confirms the ongoing local uptrend, while the RSI is moving in the upper part of the range, which may affect the price with a slight correction.

