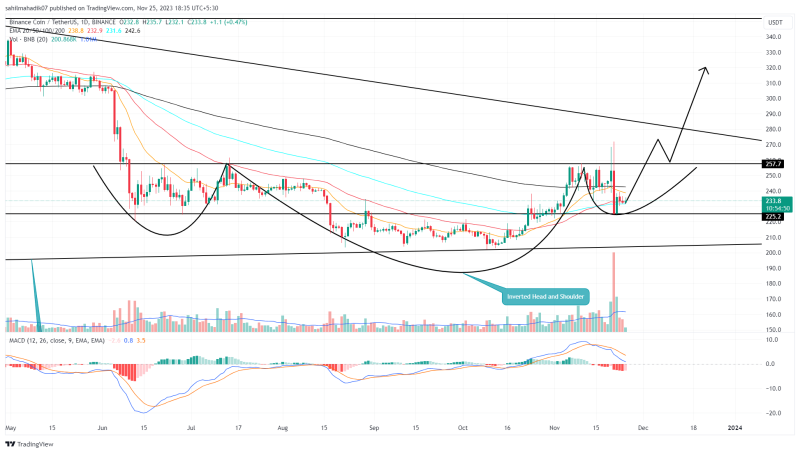
Binance Coin Price Prediction: The Binance Coin (BNB) has experienced significant volatility this week, largely attributed to the legal challenge involving Binance’s former CEO, Changpeng “CZ” Zhao. On November 21st, the BNB price saw a sharp decline, with an intraday loss of 10.95%, bringing the price down to the $225 level. Despite this, an emerging bullish pattern in the technical chart indicates a potential rebound, with buyers aiming to prevent a drop below the $200 mark.
Also Read: EBA Proposes Stricter Anti-Money Laundering Rules Amid Binance’s DOJ Settlement
Binance Coin Price Prediction: Will Buyers Lose $200 Mark?
- A symmetrical triangle pattern prevents the BNB price from major downfall
- A bullish breakout from the $257 barrier would set the price for a 22% upswing
- The intraday trading volume in the BNB coin is $645.5 Million, indicating a 9.5% gain

Source- Tradingview
Over the last five months, the Binance coin has been oscillating predominantly within a range, fluctuating between the $250 and $200 levels. While the recent dip in BNB’s price raised concerns among investors, a closer examination of the technical chart suggests that this movement is part of a larger bullish reversal pattern known as an inverted head and shoulders.
The declining BNB price has recently found reliable support around $225, forming the base of the right shoulder of this pattern. A subsequent bullish reversal from this support level has led to a 4.45% increase in the coin’s price, currently trading at about $233.
This chart pattern indicates that the coin price could potentially rise by another 10%, aiming for a neckline target of $257. A successful bullish reversal from this neckline would set the stage for a further increase, potentially elevating the price by an additional 21% to reach the $300 psychological threshold.
Moreover, this anticipated rally might see the BNB breaking through the upper boundary of a long-standing symmetrical triangle pattern, further reinforcing the bullish sentiment.
Is BNB Price Ready for Recovery?
For nearly two years, the Binance coin price has been resonating within the formation of a symmetrical triangle pattern, leading the long-term sideways trend. Under the influence of this pattern, a potential rally in BNB price would face intense supply pressure around $280. Until this pattern is intact, the BNB price will continue to walk in a lateral mode
- Exponential moving average. The flattish movement in the crucial daily EMAs( 20, 50, 100, and 200) highlights an uncertain sentiment in the market.
- Moving average convergence divergence: A bearish crossover between MACD and signal line accentuates a negative short-term trend.

