Bitcoin (BTC) price faced some volatility on Tuesday after the United States Bureau of Labor Statistics (BLS) released the October Consumer Price Index (CPI) report. The CPI data revealed that inflation continues to ease in the country at 3.2% against the market expectation of 3.3% and down from September’s 3.7%.
The Core CPI, which is a measure of inflation excluding the volatile prices of food and energy increased 4% on a yearly basis as compared to the economists’ anticipation of 4.1%.
The CPI did not change on a monthly basis but there was a 0.2% spike in the Core CPI over the same period.
The BLS stated in the press release that “The index for shelter continued to rise in October, offsetting a decline in the gasoline index and resulting in the seasonally adjusted index being unchanged over the month.”
Notably, “The energy index fell 2.5% over the month as a 5.0% decline in the gasoline index more than offset increases in other energy component indexes.”
Assessing Bitcoin Price Technical Outlook After CPI Data Release
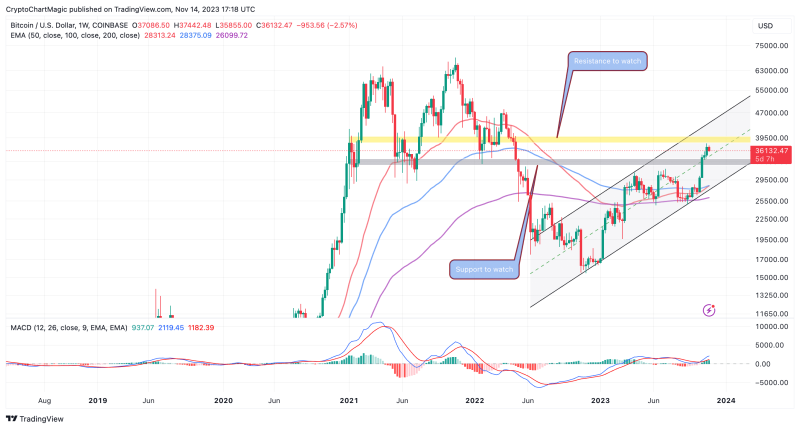
Although BTC price dumped briefly after the release of the CPI data, the correction is expected to be short-lived. The dip from Monday’s highs slightly above $37,000 such that Bitcoin price is trading at $32,270 could allow for a fresh sweep through liquidity, culminating in a larger breakout past $40,000.

Bitcoin price prediction weekly chart | Tradingview
In addition to the support provided by the buyer congestion at $36,000, the middle boundary of the ascending trendline is in line to limit price movement downwards.
Recommended for you: Polygon Price Booms 30% In A Week Unbothered By Bitcoin’s Pullback, Can MATIC Hit $1.25?
Traders looking forward to more long positions in Bitcoin may rest easy knowing that the Moving Average Convergence Divergence (MACD) indicator dons a vivid buy signal on the weekly timeframe.
The momentum backing the ongoing general uptrend is poised to increase as long as the MACD is moving higher above the neutral area in addition to the green histograms reinforcing the bullish thesis.
Bullish markets also have retracements, which are crucial for the continuation of the uptrend by providing new entry opportunities even as other traders or investors lock in the gains.
For instance, whales have been offloading their Bitcoin wallets based on an on-chain insight from crypto analyst @ali_charts. The post on X, which was reposted by Santiment, reveals that large-volume holders were either “selling
or redistributing around 60,000 $BTC over the past week, worth roughly $2.22 billion.”
These whale activities could explain the lack of momentum Bitcoin price faces above $37,000.
#Bitcoin whales have been booking profits, selling
or redistributing around 60,000 $BTC over the past week, worth roughly $2.22 billion. pic.twitter.com/xmzHGXs5gu— Ali (@ali_charts) November 13, 2023
It would be prudent for traders to keep certain key levels in mind and more importantly how BTC price reacts to them. For instance, trading above resistance at $38,000 could fuel the anticipated breakout beyond $40,000 and towards $50,000.
On the other hand, $36,000 is an area of interest to traders this week. A drop below it could lead to a bigger sell-off with support levels at $35,000 and $33,000 coming within reach.
The fact that a bullish cross on the weekly chart is almost complete, Bitcoin price may not drop to $33,000. This bullish cross is manifesting with the 50-week Exponential Moving Average (EMA) (red) moving above the 100-week EMA (blue).
Related Articles
- Solana Price Rally Captures Institutional Investor Attention, Can This Interest Thrust SOL To $100?
- Chainlink’s On-Chain Data Signals Market Optimism
- Terra Luna Classic Price Prediction: LUNC Nosedives 8% In 24 Hours, End Of The Road For The Bulls?

