The crypto market experienced a sharp downturn on January 3rd, with most major cryptocurrencies painted red. Bitcoin, the leading digital currency, suffered a significant blow, dropping 6-7% to retreat to the $43,000 level. This decline is widely believed to be a reaction to the potential denial of the SPOT Bitcoin ETF by the US SEC, a concern recently underscored by Matrixport, a digital financial services platform.
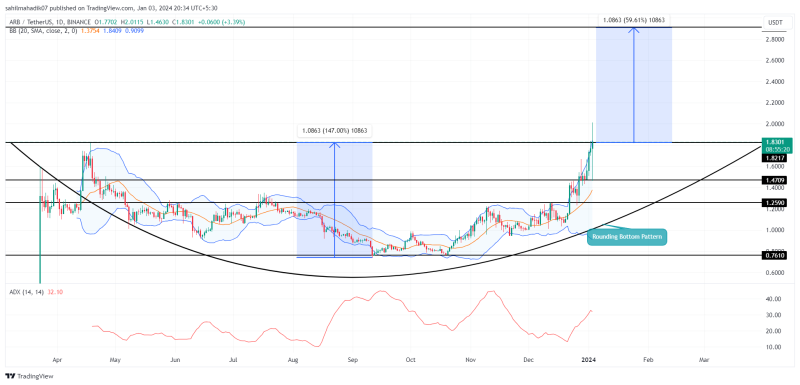
Despite this widespread sell-off, Arbitrum (ARB), an Ethereum Layer 2 scaling solution, demonstrated remarkable resilience, regaining and surpassing the crucial $1.82 mark. This level is not only a recovery point but also marks a breakout from a bullish reversal pattern known as the rounding bottom.
Bullish Pattern Set a 60% Breakout Rally
- A long-tail rejection candle in daily candle hints the market buyers are accumulating at a price dip
- A rounding bottom pattern governs the current recovery in ARB price
- The intraday trading volume in ARB is $2.47 Billion, indicating a 110% gain.

Arbitrum Price Prediction| TradingView Chart
The Arbitrum price recovery trajectory began in late October, with its value bouncing back from a low of $0.76. Since then, the asset has seen an impressive 140% surge, reaching a current trading price of $1.85.
According to information obtained from DefiLlama, the total value locked (TVL) in the Arbitrum network reached a new high of $2.5 billion on Wednesday. This surge in TVL indicates a growing interest among traders and anticipation of a significant recovery in 2024
The formation of a bullish reversal pattern amid this upturn is indicative of persistent investor accumulation and a strong potential for further gains. Despite the overall market’s sudden downturn on January 3rd, which briefly pushed ARB’s price down to $1.46, buyers swiftly countered this drop, propelling the price above the $1.82 threshold.
This move is significant, as maintaining above this level could confirm a rounding bottom breakout and early signs of trend recovery. Under the influence of this chart pattern, the ARB price may prolong its recovery by 60% to hit potential targets in the range of $2.91 to $3
Will ARB Price Fall Back to the $1.25 Mark?
The current market sentiment seems favorable for ARB, but a close below the pivotal $1.82 mark could signal a delayed recovery, as sellers may initiate further price corrections. This bearish scenario could gain further credence if the US SEC decides against the Bitcoin spot ETF, as Matrixport has warned. In such a case, ARB could find support at lower price levels, specifically around $1.47 and $1.25.
- Bollinger Band: The upturn in the upper boundary of the Bollinger Band indicator reflects that buyers are currently dominating this asset.
- Average Directional Index: The ADX slope rises at 32 Mach to reflect the coin may soon hit exhaustion.
Related Articles
- Justin Sun Allegedly Moved 50Mn USDT to Binance Amid Market Drop
- Crypto Price Prediction For January 3: SOL, ICP, MKR
- Bitcoin Price Dumps To $40k As Doubts Linger Over Spot ETF Approval, Can BTC Weather the Storm?

