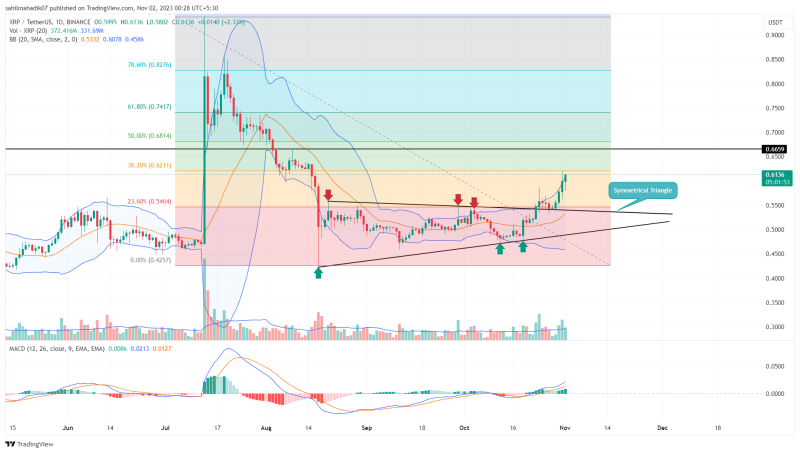
XRP Price Prediction: On October 23rd, XRP coin broke free from a two-month-long accumulation phase, signaled by its exit from a triangle pattern. The subsequent rally pushed the coin’s price from $0.54 to its current trading level of $0.6, marking an 11% gain. But given the current market volatility, can buyers sustain this momentum?
Also Read: Pro-XRP Lawyer Shares Exciting Development With XRP Army
Triangle Pattern Sets Extend Recovery.
- Completion of the triangle pattern sets the XRP price for another 12% surge.
- The $0.66 level stands as crucial resistance against buyers.
- The intraday trading volume in the XRP is $1.56 Billion, indicating a 29% gain
Source: Tradingview
Over the last couple of months, the XRP price has primarily traded sideways, confined within the triangle pattern’s trendlines. Typically, this pattern is considered a continuation pattern, and in this context, it would imply a downward trend.
However, buoyed by broader market sentiment, the XRP price broke through the upper trendline, reflecting an early sign of trend change. This high-momentum breakout on October 23rd and a successful reset to check price sustainability on the 27th reflect this altcoin price is ready for a sustainable recovery.
Amid the current market uncertainty, the XRP price surged by a modest 0.3%, forming a neutral daily candle. According to this pattern, the coin price looks set for another 12% gain, potentially reaching the $0.655 level.

1 XRP to USD = $0.6085641 -0.52% (24h) Buy / Sell


Buy Crypto on an easy to use platform
Invest in leading cryptocurrencies such as Bitcoin, Ethereum, Cardano and more…

XRP

USD
Will XRP Recovery Hit $0.75?
The anticipated XRP price rally to $0.655 would also hit the 50% retracement level of the correction phase which was initiated in mid-July. The potential traders may face intense supply pressure at this level, which stands as a crucial level for sellers to resume the prevailing downtrend. Having said that, a breakout above this barrier would reflect weakness in bearish momentum which could prolong the recovery trend to $0.75.
- Bollinger Band: The upstream in the upper band of the Bollinger band indicator reflects the buyers are still aggressive in nature.
- Moving Average Convergence Divergence: A steady rise between the MACD(blue) and signal(orange) line reflects a recovery sentiment in the market intact.


