A bullish symmetrical triangle pattern was formed on LTC’s chart, which could result in a bull rally soon.

- LTC’s daily chart revealed a few bullish market indicators.
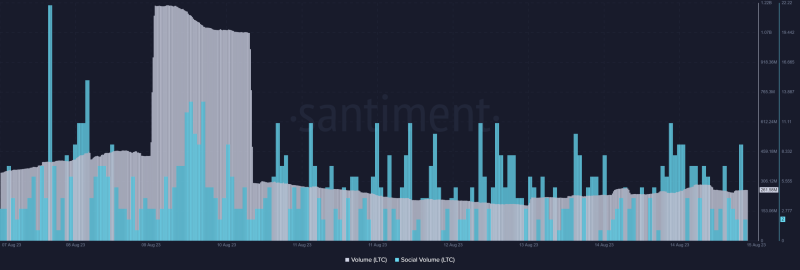
- Litecoin’s social volume and trading volume declined last week.
The crypto market has been inert of late as not much volatility was seen on the charts of the top cryptos. Litecoin [LTC] also followed the current market trend as its price remained slow-moving.
Though the current market is not behaving in investors’ best interests, the upcoming months can turn out to be different for LTC. Especially considering its latest halving, which took place on 2 August 2023. In fact, a major bullish pattern was noted on the coin’s chart, which can lead to a bull rally.
Litecoin expecting a breakout after halving?
Like most cryptos, LTC’s price chart remained relatively flat throughout the week. According to CoinMarketCap, LTC’s price only moved marginally, and at press time, it was trading at $81.70.
The coin had a market capitalization of over $6 billion, making it the 13th largest crypto. Sadly, investors’ interest in trading the token declined, as its trading volume dropped last week. Moreover, LTC’s popularity also decreased, as evident from the dip in its social volume.

The current scenario was not as expected by many, as the blockchain recently completed its third halving. Though the event did not have an immediate effect on LTC’s price, it definitely helped the blockchain’s mining industry grow.
As per Coinwarz’s data, LTC’s hashrate has been on the rise for the last seven days. At press time, LTC’s hashrate stood at 786.59 TH/s.
Nonetheless, an analyst pointed out in a recent tweet that a bullish pattern had formed on the coin’s chart, which could result in a rally over the coming months.
Litecoin was at the end of the symmetrical triangle, and the last two times have resulted in a quick expansion in price. Belew expects LTC’s price to reach an all-time high during the last quarter of this year.
I think this is the last week to accumulate litecoin before Litecoin goes on its face melting move.
Litecoin is now at the end of the symmetrical triangle that the last two times has resulted in quick expansion in price.
This time its more akin to 2017 break out due to the… pic.twitter.com/LHxtkl6yIb
— master (@MASTERBTCLTC) August 13, 2023
Here is what can be expected in the short-term
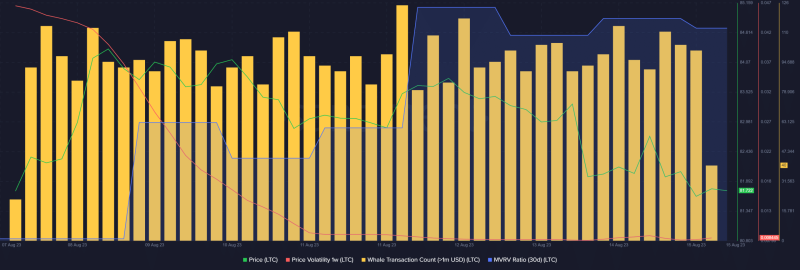
Interestingly, despite LTC’s price action, whale activity around the coin remained high. LTC’s MVRV Ratio also went up, which was a positive signal. However, the coin’s 1-week price volatility remained substantially low.

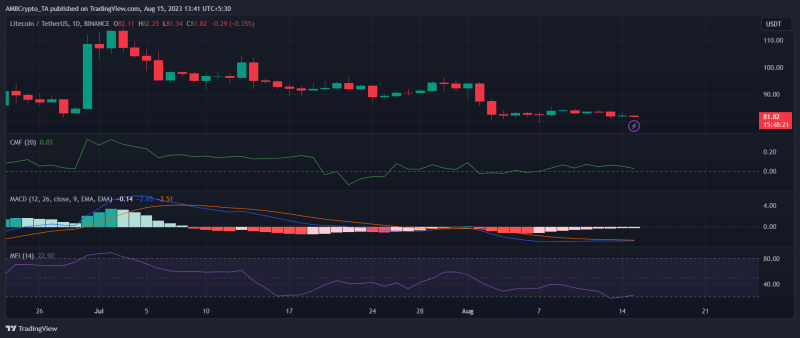
A look at LTC’s daily chart pointed out that its MACD displayed the possibility of a bullish crossover. Additionally, Litecoin’s Money Flow Index (MFI) registered an uptick from the oversold zone, which can increase buying pressure.
Nonetheless, its Chaikin Money Flow (CMF) went down, which might restrict LTC’s price from moving up in the near term.


