The Bitcoin (BTC) price and crypto market cap (TOTALCAP) are both showing bearish signs inside an important resistance area. The Compound (COMP) price has increased massively since June 10 without experiencing any pullback.
Bitcoin market volatility is expected to rise today since almost $5 billion in Bitcoin options are expiring. This marks the largest mass expiry in months.
Crypto Market Cap (TOTALCAP) Makes Attempt at Moving Above Resistance
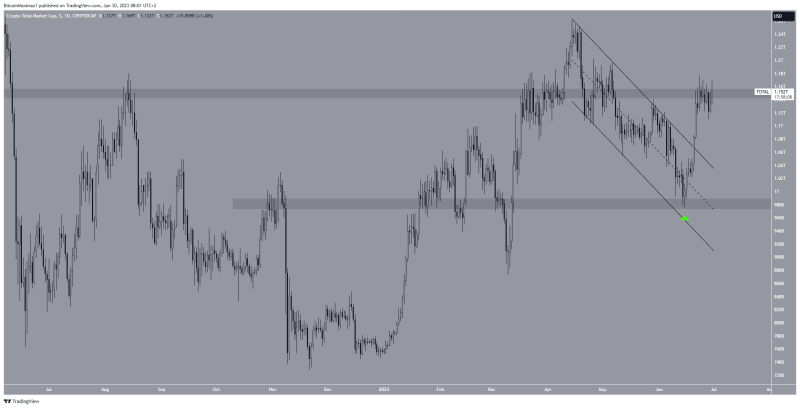
On June 15, there was a notable recovery in the TOTALCAP, which confirmed that the support level of $980 billion is reliable. It took five days for the TOTALCAP to move above a downward parallel channel, resulting in a peak value of $1.17 trillion on June 23.
However, the price has subsequently experienced a slight decline and struggled to surpass the resistance level of $1.15 trillion.

TOTALCAP Daily Chart. Source: TradingView
If a breakthrough occurs, there is potential for the TOTALCAP to increase towards the next resistance level of $1.30 trillion, establishing a new peak for the year. Conversely, if the price is rejected, it could decrease toward the closest support level at $980 billion.
More From BeInCrypto: Crypto signals: What Are They and How to Use Them
Bitcoin (BTC) Price Creates Double Top Pattern
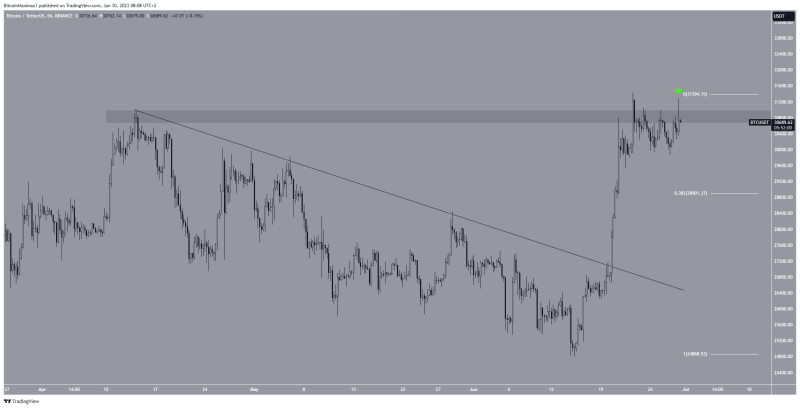
On June 20, the price of Bitcoin broke out from a descending resistance line. It reached a new yearly high of $31,431 three days later. Despite this increase, BTC failed to close above the $30,800 resistance area. Rather, it created a long upper wick yesterday (green icon) and has fallen since.
Moreover, it seems that the BTC price has created a double top, considered a bearish reversal pattern.

BTC/USDT Six-Hour Chart. Source: TradingView
If the BTC price falls in the short term, the closest support will be at the 0.382 Fibonacci level, which is at $29,000. However, if the price continues to rise and breaks out, the next closest resistance will be at $35,000.
Read More: Top 11 Crypto Communities To Join in 2023
Compound (COMP) Is in the Midst of a Sharp Reversal
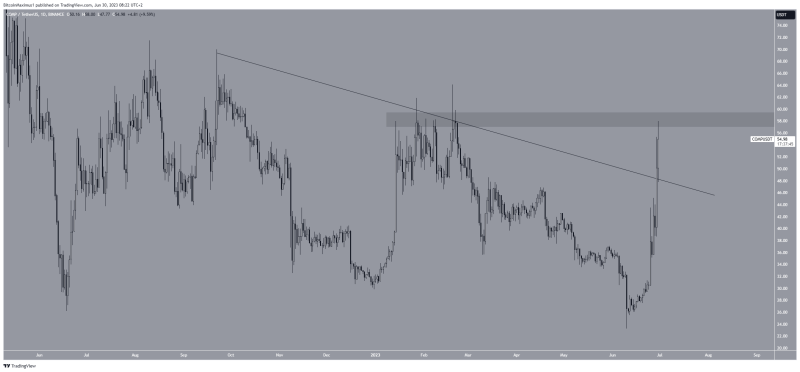
The COMP price has been on a tear since June 10 and increased by 150% in the process. On June 29. the price broke out from a descending resistance line. It is now approaching its yearly high at $58.

COMP/USDT Daily Chart. Source: TradingView
If COMP moves above this resistance area, it could accelerate its rate of increase to $100. However, a drop to the resistance line at $48 could transpire if the price gets rejected.

