Despite Bitcoin’s performance after ETF approvals, there has been a hike in institutional interest.

Edited By: Saman Waris
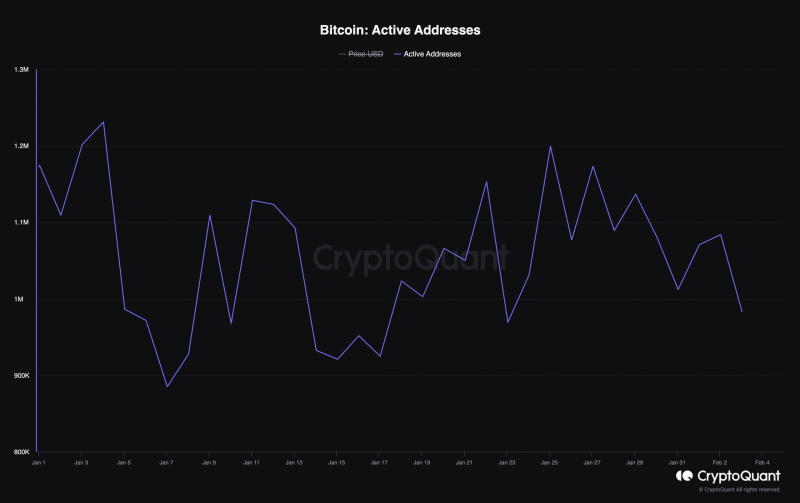
- There has been a decline in the number of BTC active addresses since ETFs went live.
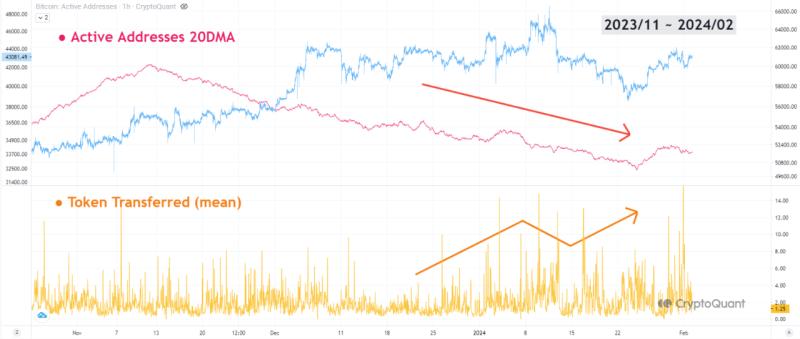
- However, the amount of BTC token transfers has increased, showing high institutional interest.
The amount of Bitcoin [BTC] token transfers has continued to rise despite the leading coin’s poor price performance since the U.S. SEC approved all spot ETF applications on the 10th of January.
In a new report, CryptoQuant analyst Yonsei Dent found that BTC’s price performance after ETF approval has led to a decline in the count of active addresses participating in transactions involving the crypto asset.
According to data from CryptoQuant, since the 10th of January, the daily count of unique active addresses involved in BTC transactions, either as a sender or receiver, has plunged by 13%.

Dent opined that this decline in BTC’s network activity “may not necessarily be seen as a negative signal” as the coin continues to witness high token transfers.
Dent said,
“This substantial increase in the number of tokens transferred per address can be seen as evidence of the presence of significant institutional capital and other large investors entering the market in response to the ETF approval issue.”

BTC Spot-ETF in the last week
AMBCrypto found that the last trading week closed with a spot BTC ETF volume of $1 billion, per data from The Block’s data dashboard. During the five-day trading period, the volume declined by 37%.
Further, the closing volume marked the lowest the spot BTC ETF market has ever closed at since it launched in early January.

At press time, the Grayscale Bitcoin Trust (GBTC) controlled a 38% share of the entire BTC spot ETF market, according to data from The Block. At the same time, GBTC’s assets under management (AUM) totaled $21 billion.

Sentiments seem to be improving
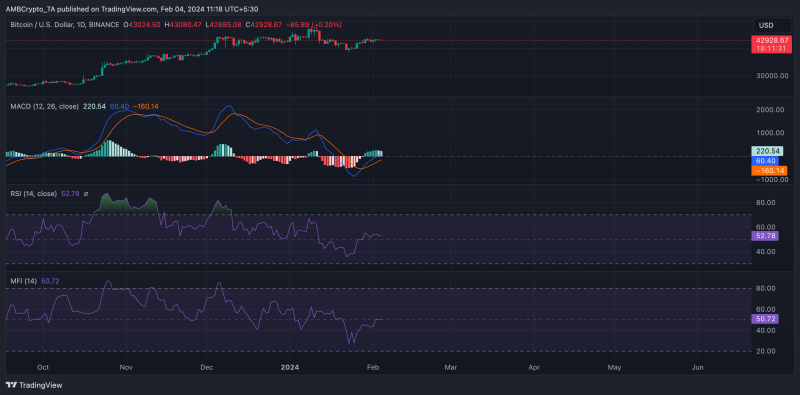
An assessment of BTC’s price movements on a daily chart revealed a gradual shift in market sentiments from bearish to bullish.
A major indicator of this shift was the coin’s Moving Average Convergence Divergence (MACD) indicator.
On the 28th of January, the MACD line (blue) crossed above the trend line (orange) and was poised to rally above the zero line at press time.
This kind of intersection signals the commencement of a new bull cycle caused by a gradual resurgence in demand for an asset.
Read Bitcoin’s [BTC] Price Prediction 2024-25
Likewise, key momentum indicators were spotted in uptrend positions. BTC’s Relative Strength Index (RSI) was 52.78, while its Money Flow Index (MFI) returned a value of 50.72.

These indicators’ values and positions showed that buying pressure had begun to outpace coin sell-offs.

