Contents
While the majority of major cryptocurrencies, including Bitcoin and Ethereum, walked a sideways trend in September, a few tokens defied this broader market stagnation. Given below are some standout altcoins that not only resisted the bearish undertones but also outperformed their peers. The resilience shown by these tokens, even amid lackluster market sentiment, raises compelling questions about their potential for higher gains—especially if the overall crypto market swings back to a bullish stance.
Also Read: US SEC Delays ARK Spot Bitcoin ETF Filing; Blackrock Decision Soon?
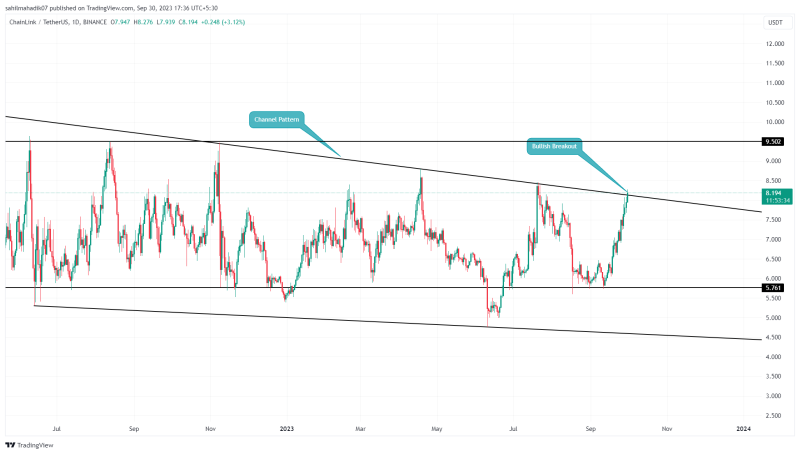
LINK Price Analysis: Buyers Breakout 450 Days Resistance

Source- Tradingview
Amid the September 2nd week recovery in the crypto market, the Chainlink coin price rebounded from the $5.75 mark. The resulting reversal witnessed an upright rally, which registered a nearly 42% gain within three weeks.
By the press time, the LINK price trades at $8.145 and attempts a bullish breakout from the long-coming resistance of the falling channel. This chart pattern has been influencing the coin’s price movements for over a year, indicating this breakout would be a major signal of trend reversal.
A bullish breakout above the overall trend line with daily candle presence could be an opportunity to go long.
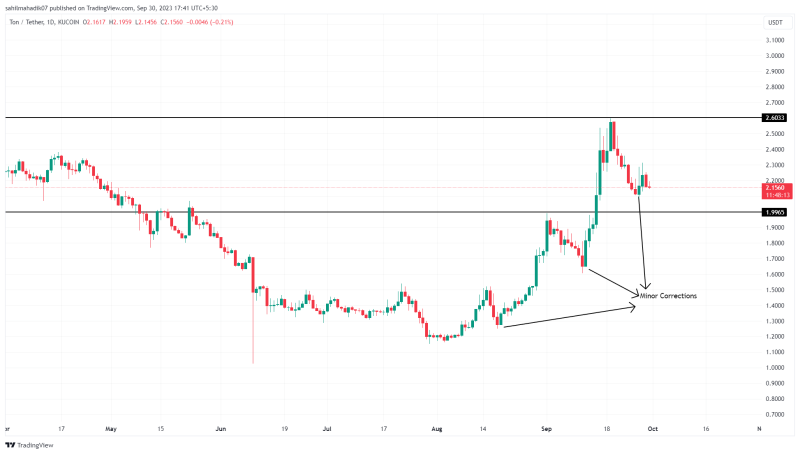
TON Price Analysis: Minor Correction Before the Next Leap

Source- Tradingview
In the daily chart, the Toncoin price showcased a parabolic rally, surging from a $1.16 low to a striking $2.59 high, marking a 121% total growth. However, this meteoric rise was tempered by a recent 18% correction over two weeks.
Despite this dip, the pattern isn’t necessarily alarming; the TON price has exhibited similar growth-and-correction cycles since its rally began. Should the coin maintain levels above $2 support, it could embolden investors to propel the asset toward the next resistance at $2.6, thereby extending its prevailing bullish trend.
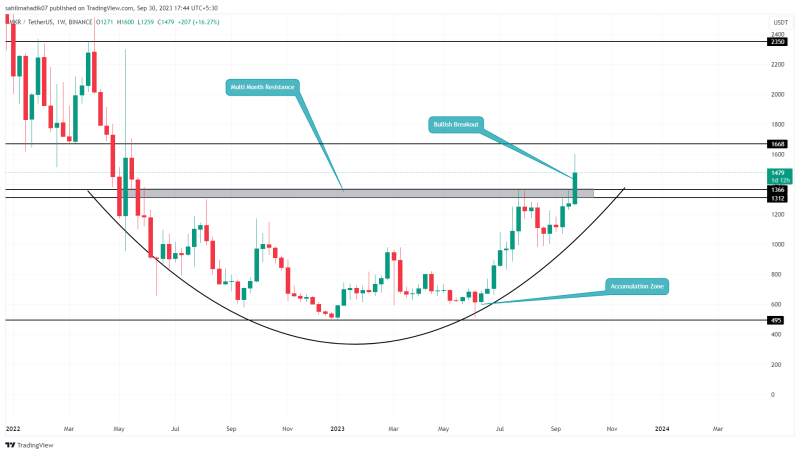
MKR Price Analysis: Breaks Free from Accumulation Zone

Source- Tradingview
The MKR price has largely been in a sideways trading range for over a year, confined between a support zone at $500 and a resistance barrier at $1,366. A significant change occurred around mid-July when the coin ignited a bullish rally, soaring up to 214% to reach a new high of $1,600.
This rally shattered the long-standing $1,366 resistance, suggesting the coin might be entering a new bullish phase. As of the latest pricing data, Maker coin price is trading at $1,484, marking a 2% intraday gain.
If it can sustain levels above the recently breached $1,366 mark, the upward momentum could easily carry it past the $1,600 high, further solidifying its bullish trend.
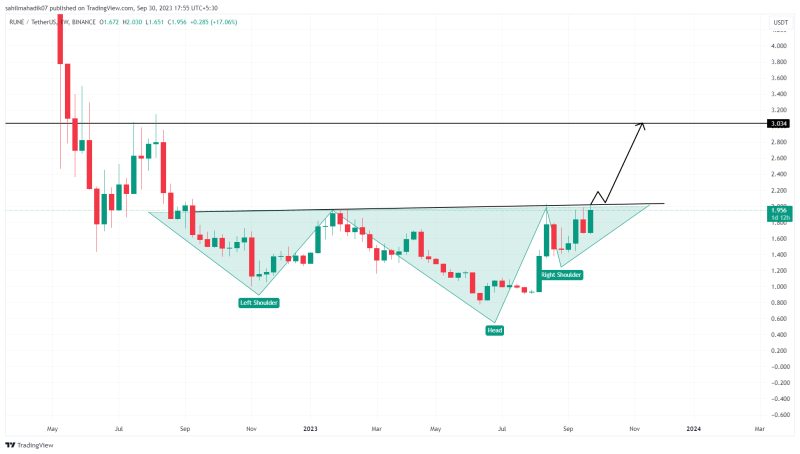
Rune Price Analysis: Bullish Reversal Pattern Set $3 Target

Source- Tradingview
Since September 2022, the Thorchain coin price has witnessed a sideways consolidation phase, capped by an overhead resistance level of $2. Yet, the coin’s daily chart has been forming what appears to be an “inverted head and shoulders” pattern.
This pattern is often considered a bullish reversal sign and typically emerges at the bottom of a market cycle. Specifically, on September 12, the RUNE price initiated a significant recovery, surging from $1.45 to nearly touch the $2 mark—a whopping 40% leap.
Should buyers successfully break above this key $2 neckline resistance, it would validate the bullish pattern and potentially set the stage for a rally toward the $3 level.

