The stablecoin metrics on Solana have been seeing an increase, indicating increased liquidity.

- Solana has become the network with the highest stablecoin transfer volume.
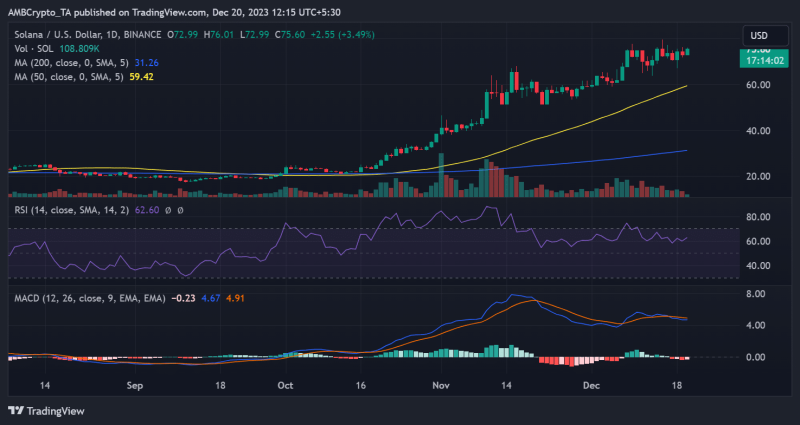
- SOL has increased by over 3% to trade around $75.
Lately, Solana [SOL] has experienced notable upward trends in several important metrics, with the stablecoins metric being the most recent to show an uptrend.
Solana tops stablecoin transfer volume chart
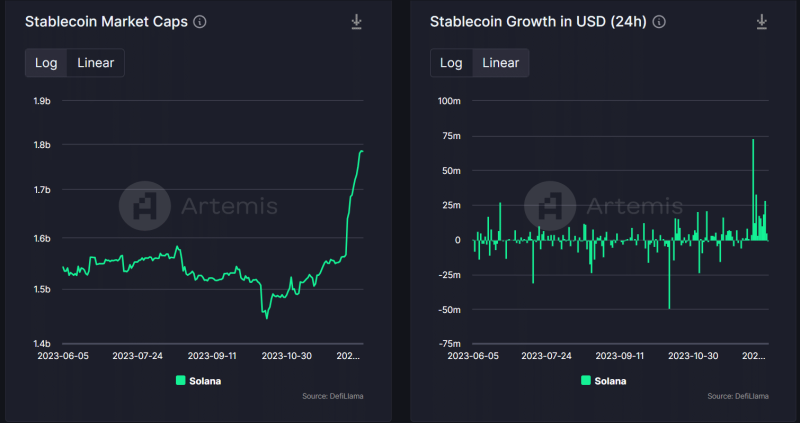
Based on AMBCrypto’s analysis of Artemis data, both the stablecoin market cap and stablecoin growth on Solana have witnessed an increase.
The stablecoin metric showed a notable increase in inflow, particularly in December, surpassing levels observed in previous months. This marked the first time such consistent inflow volume has been observed in several months.
Additionally, the stablecoin market cap showed a significant uptrend in December. As of this writing, it was over $1.7 billion, a level last seen in March.

Furthermore, another Artemis chart showed that Solana has consistently ranked among the top three networks with the highest stablecoin transfer volume since mid-October.
The transfer volume was over $10 billion and has been steadily rising. Notably, Solana recently claimed the top position as the network with the highest transfer volume.
According to the chart, the stablecoin transfer volume was $36.12 billion in the last seven days.
Also, the chart shows that it has seen the highest growth rate in the last 198 days. Within this period, its transfer volume was around $66.5 billion.
Solana volume and TVL maintain uptrend
Analysis of the volume chart on DefiLlama showed a sustained increase in volume since the uptick began in December. Over the past few days, the volume has consistently exceeded $500 million.
Also, it has surpassed $900 million in the last two days, approaching the billion-dollar mark.
Furthermore, the Total Value Locked (TVL) has displayed a continuous upward trend, maintaining its trajectory since entering the $1 billion range. This was shown by the fluctuating yet ascending pattern on the chart.
The TVL was around $1.08 billion at the time of this writing.
The SOL trend
As of press time, Solana was recovering after its loss in the previous trading session. The daily timeframe chart showed that it was trading at around $75, reflecting an increase of over 3%.
Is your portfolio green? Check out the SOL Profit Calculator
Additionally, the Relative Strength Index (RSI) has sustained its trend above 60 after experiencing a recent decline.

Considering the present trajectory and barring any abrupt price declines, it is probable to conclude that SOL will conclude the year above $6. Optimistically, it could finish the year within the $70 price range, or even higher.

