A bearish descending triangle pattern appeared on Shiba Inu’s price chart. Here’s what it means…

Edited By: Jibin Mathew George
- SHIB recorded a hike of over 2% in the last 24 hours
- Most metrics and indicators hinted at a price correction though
The market condition somewhat changed in the last few hours, allowing several cryptos, including Shiba Inu [SHIB], to turn bullish. While this seemed to be an optimistic sign, at press time, a bearish pattern was laying claim to the memecoin’s price charts.
Bears stake their claim on SHIB
According to CoinMarketCap, SHIB finally turned bullish after a sluggish week, as its value climbed by over 2% in 24 hours. At the time of writing, the memecoin was trading at $0.00002348 with a market capitalization of over $13.8 billion, making it the 11th largest crypto.
However, it was surprising to note that despite the latest price uptick, bearish sentiment around SHIB seemed to grow.

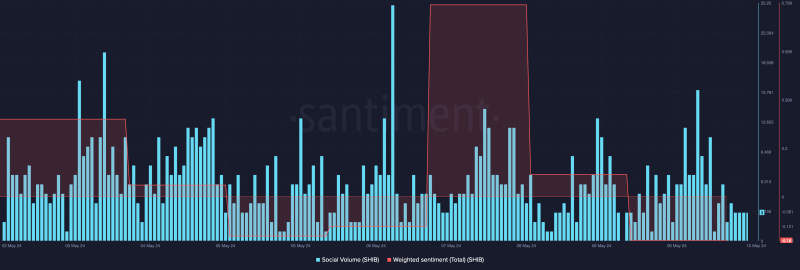
This was evidenced by the dip in its weighted sentiment. The memecoin’s social volume also declined last week, reflecting a drop in its popularity.
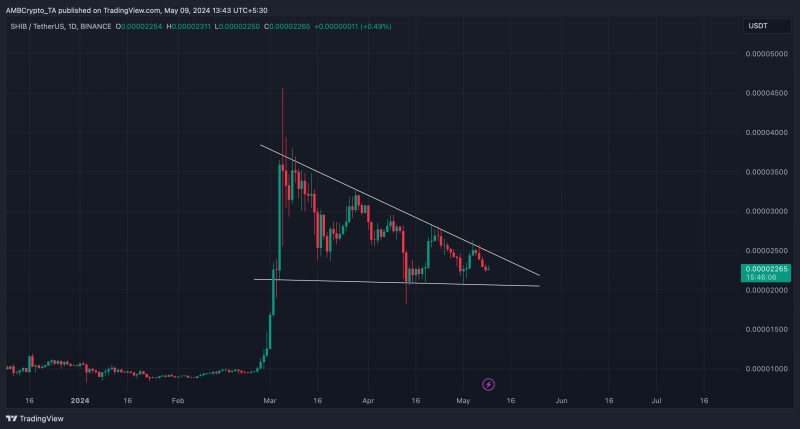
Alas, concerns for SHIB are far from over. AMBCrypto’s analysis of Shiba Inu’s daily chart revealed a descending triangle pattern. For starters, it was a bearish pattern, which often results in price declines after a southward breakout.

Is a price decline inevitable?
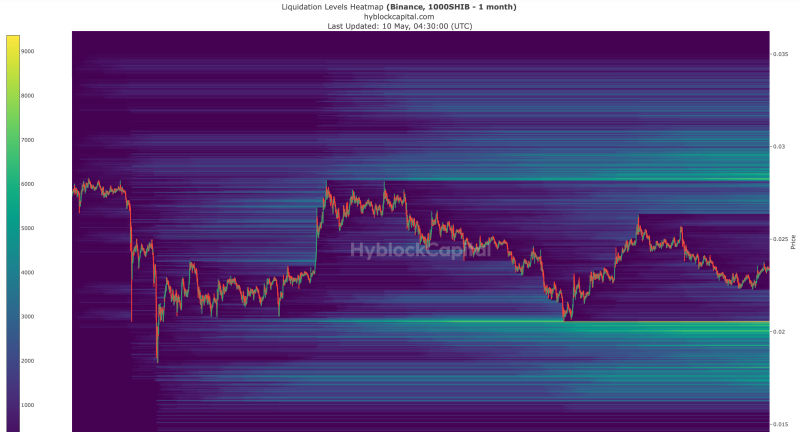
AMBCrypto’s analysis of Hyblock Capital’s data revealed that if SHIB’s price declines in the near term, its value might drop to a crucial support near $0.000020. If this is the case, liquidations would rise sharply at that level.
A fall under the same could be disastrous for the memecoin as its price might then plummet to $0.000015.

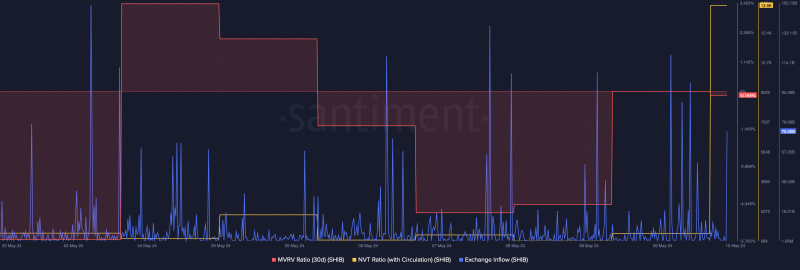
We then checked Santiment’s data to see what the memecoin’s metrics were suggesting. As per our analysis, Shiba Inu’s NVT ratio spiked sharply. A rise in this metric means that an asset is overvalued, hinting at a price drop.
The memecoin’s exchange inflows also increased sharply last week, meaning that selling pressure on SHIB was high. On the contrary, the MVRV ratio was bullish as it improved over the last few days.

A few of the market indicators also remained bearish for Shiba Inu. For example, the Chaikin Money Flow (CMF) registered a sharp downtick. Its Relative Strength Index (RSI) was resting under the neutral zone as it had a value of 45.5.
These indicators suggested that a price drop is likely in the coming days.
Here, it’s worth noting that the Money Flow Index (MFI) remained bullish as it registered an uptick on the charts.

