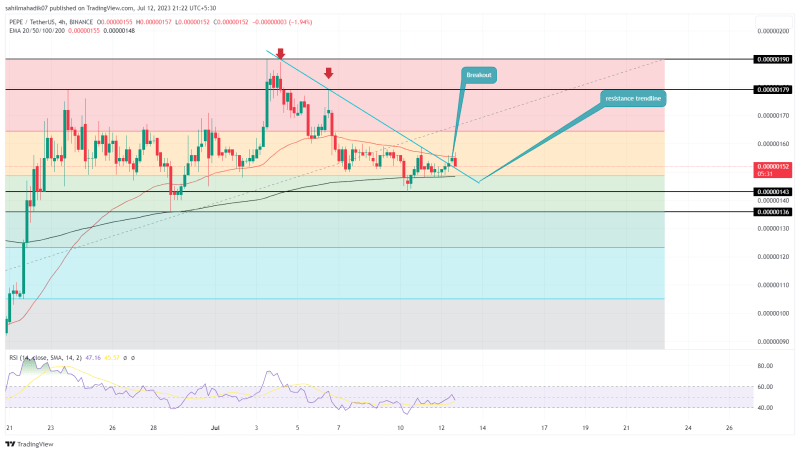
Pepepcoin Price Analysis: In the midst of a challenging market environment, the Frog-themed meme coin PEPE experienced a significant correction phase, driven by a downsloping trendline. Over the course of one week, the Pepecoin price plummeted by 24.5%, dropping from $0.0000019 to $0.00000143 support. However, recent positive movements in leading cryptocurrencies like Bitcoin and Ethereum have provided a much-needed boost for buyers. With a successful breach of the overhead trendline, this memecoin is likely to resume a bullish rally.
Also Read: Pepecoin Price Analysis: Will $PEPE Price Surpass $0.000002 in July?
Pepecoin Price Daily Chart
- The Pepecoin correction phase above 50% Fibonacci retracement support indicates the overall trend is bullish.
- Trendline breakout offers buyers an opportunity with a bullish upswing of 25%
- The 24-hour trading volume in the Pepecoin coin is $114.5 Million, indicating a 56 % gain.

Source-Tradingview
The recent uptick in Bitcoin and Ethereum has had a positive impact on PEPE’s price movement. The coin has successfully broken out from the downsloping resistance trendline, marking a potential end to the correction phase.
By the press time, the PEPE price trades at $0.00000152 with an intraday gain of 0.66%.
However, the 4-hour timeframe chart shows that the PEPE price is undergoing a retest to the breached trendline to validate its sustainability. This retest is a crucial step in confirming the strength of the bullish momentum. If the uptrend persists, PEPE’s price could rise by 25.14%, presenting an opportunity to rechallenge the $0.0000019 level.
Will Pepecoin Coin Revist the 0.00000139 Mark?
If the retest phase plunges below the trendline and breaks the 200 EMA slope, the bullish thesis will get invalidated. This breakdown could prolong the prior correction and push the price to $0.00000139, aligned with the 50% Fibonacci retracement level.
- Exponential Moving Average: The 50 and 200 EMA slopes create a range structure and a breakout from either of them will offer an additional confirmation to respective ends.
- RSI: The 4-hour RSI slope yet to cross 50% indicates a lack of bullish momentum.

