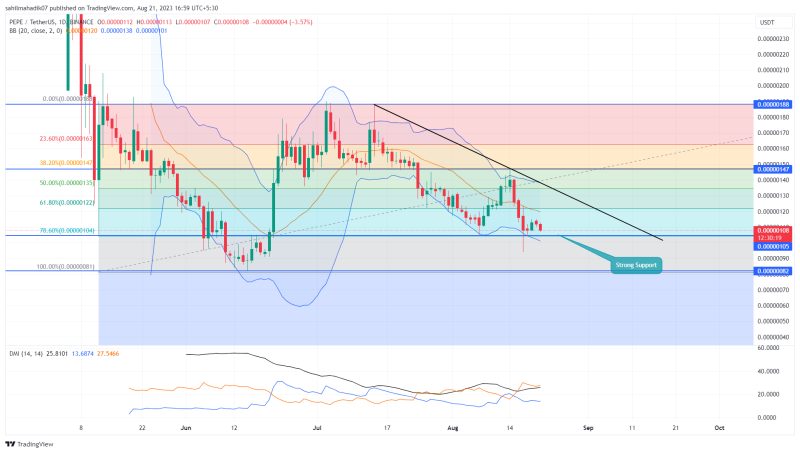
Since Mid-August, the cryptocurrency market has been experiencing heightened selling pressure, leading to extended correction in prices across various digital assets. Among them, a Frog-themed memecoin PEPE encountered a substantial decline in its price, reflecting the current market sentiment. The falling prices are threatening another breakdown from the key support level, suggesting the PEPE price could witness further downfall.
Also Read: Double Bottom Pattern Sets Pepe Coin for 28% Rally
Pepe Coin Day Chart: Key Points
- The formation of the V-top pattern indicates a shift from bullish to bearish sentiment, which could potentially signify a broader trend reversal
- A possible breakdown below the $0.00000105 could set the PEPE price for a 22% drop
- The 24-hour trading volume in the Pepe coin is $48.6 Million, indicating a 27.5% loss.

Source- Tradingview
After reaching the $0.00000147 mark, the PEPE price underwent a dramatic reversal, plummeting by 29%. This reversal has formed what is commonly referred to as a “V-top” reversal pattern. The increased volume accompanying this decline signals strong selling pressure, which has played a pivotal role in driving the price down.
On August 19th, the PEPE price displayed a glimmer of hope for a potential rebound as it formed a morning star candlestick pattern. However, the lack of substantial follow-through in terms of price movement following the candle setup has raised concerns about the strength of the bullish momentum.
As of the time of writing, the PEPE price is trading at $0.00000108, reflecting an intraday loss of 3.57%. This loss underscores the persistent selling pressure that continues to plague the token. With the price trading close to the $0.00000105 support level, there is a looming risk of another breakdown. Such a breakdown could catalyze a further decline in the price by approximately 22%, potentially bringing it down to $0.0000081.
Can Pepe Coin Sutain $0.00000105 Level?
While the negative approach seems viable for Pepe coin, this memecoin has bounced twice from $0.00000105 within a month indicating the active accumulation of buyers. The 78.6% Fibonacci retracement level aligned at the same path increases the support strength of this footing. In the coming days, if the buyers manage to hold above this support, the altcoin could show another attempt at recovery and chase $0.00000147 peak.
- Average Directional Index: An uptick in the daily ADX slope reflects the sellers having enough steam to prolong this ongoing downfall.
- Bollinger Band: The downsloping lower band of the Bollinger Band indicator reflects the selling momentum is still aggressive.

