Pepe Coin Price Prediction: PEPE, The Frog-themed Memecoin, has been experiencing a downward trend for almost two months, following its peak price of $0.00000175. This correction phase wiped out over 50% of the gains made during its rally in October-November, leading to a 46% drop in the PEPE price, which now stands at $0.00000094.
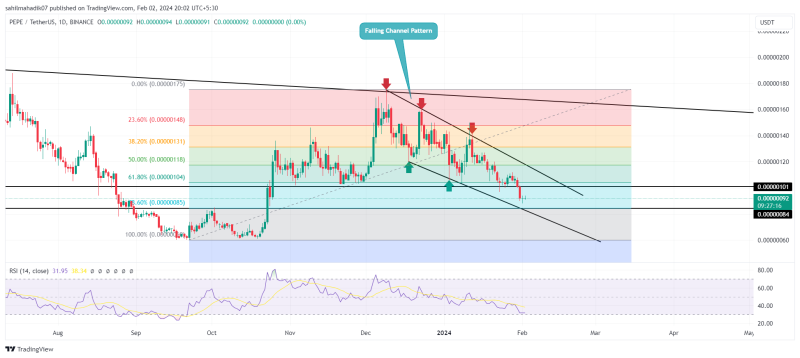
Nonetheless, an analysis of the daily time frame chart reveals that this pullback is forming a bullish reversal pattern, potentially signaling a resurgence of buyer interest in this memecoin.
Key Retracement Level Set PEPE Price for Fresh Rally?
- The PEPE price rebounded at least thrice from the channel pattern boundaries reflecting the strong influence it has on market participants.
- The declining price may find a surge in demand pressure at $0.00000084 support
- The 24-hour trading volume in the Pepe coin is $49.47 Million, indicating a 39% gain.

Pepe Coin Price Prediction| TradingView Chart
As of the latest update, Pepe coin price trades at $0.00000094, marking a 1% intraday gain. This modest rise hints at a possible retest to the recently breached psychological level of $0.000001, testing its stability at this lower plateau.
However, if the coin continues to face significant selling pressure, this downtrend may extend, driven by a descending channel pattern. The closest support level for PEPE investors is pegged at $0.00000084, aligning with the 78.6% Fibonacci retracement level.
Although such a steep decline suggests a diminishing bullish momentum, the solid support level may present an opportunity for buyers to launch a counteroffensive. A bounce back from this support zone could trigger a bullish breakout from the descending channel, marking an early indication of a potential trend reversal.
Is PEPE Price At the End Of Correction Trend?

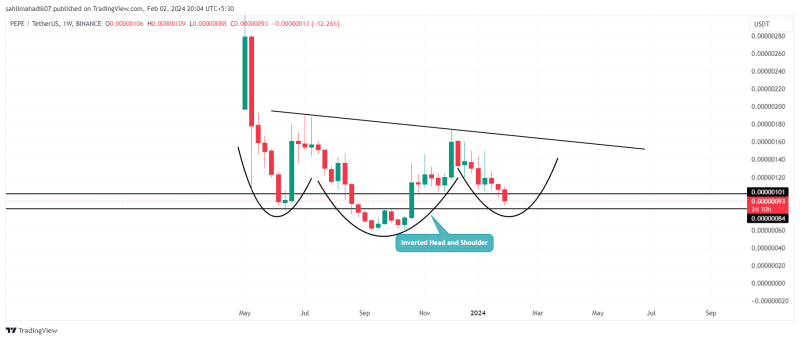
PEPE Price| TradingView Chart
The weekly time frame chart shows the Pepe coin price is developing a well-known bullish reversal pattern called inverted head and shoulder. If the chart pattern holds true, this memecoin is witnessing a last pullback before the price surges back to the neckline resistance around $0.00000165, registering a potential 80% gain.
- Bollinger band: A downtick in the lower boundary of the Bollinger band reflects the selling momentum is still aggressive.
- Relative Strength Index: The daily RSI slope at 33% indicates that further correction may push the PEPE price to an oversold region.
Related Articles:
- Crypto Prices Today: Bitcoin, Ethereum, Solana, Pepe Coin Recover As PYTH Leads Rally
- Bonk Vs MEME AI : Which Memecoin Will Rally the Most in 2024?
- Ethereum’s Vitalik Buterin Spooks Memecoin World With This Post

