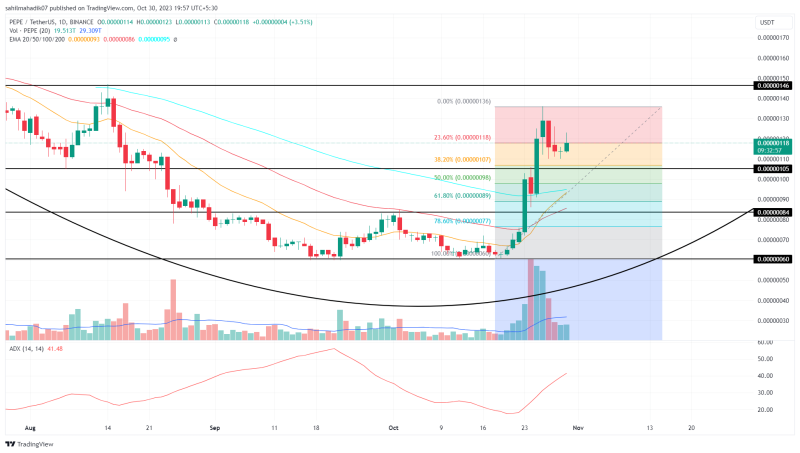
Pepe Coin Price Prediction: In the face of a recent downturn in the cryptocurrency market, the Pepe coin recovery rally hit a significant snag at the $0.000001369 price point. This initiated a bearish reversal, eroding the asset’s market value by approximately 13.35% over the past four days. Here are the key levels that can bolster buyers to sustain higher ground and resume the prevailing recovery.
Also Read: Bitcoin Forms Historic “Golden Cross” For ATH After Halving, PlanB’s S2F Signals “Buy”
Will PEPE Price Lose $0.000001 Mark?
- The ongoing correction may assist buyers in replenishing the exhausted bullish momentum.
- The $0.00000105 level may offer strong support in the current pullback.
- The 24-hour trading volume in the Pepe coin is $140 Million, indicating a 57% gain.

Source- Tradingview
Earlier today, the Pepe coin price surged by 8% and momentarily reclaimed the $0.0000012 level. However, the price was rejected immediately with a long-wick candle formation suggesting that the overhead selling pressure remains intact.
This active defense by sellers implies that this memecoin could be heading for an extended corrective period. Nevertheless, given the impressive rally Pepe price experienced in the fourth week of October, a minor pullback could be beneficial for maintaining a long-term bullish trajectory.
According to the Fibonacci retracement tool, the buyers can obtain immediate support around the $0.00000105 level, in alignment with the 38.2% Fib level, and subsequently at the $0.0000098 mark, corresponding with the 50% retracement level. Should the coin stabilize at either of these benchmarks, it is poised to resume its bullish course, potentially soaring $0.00000145 situated 25% up from its current trading price.
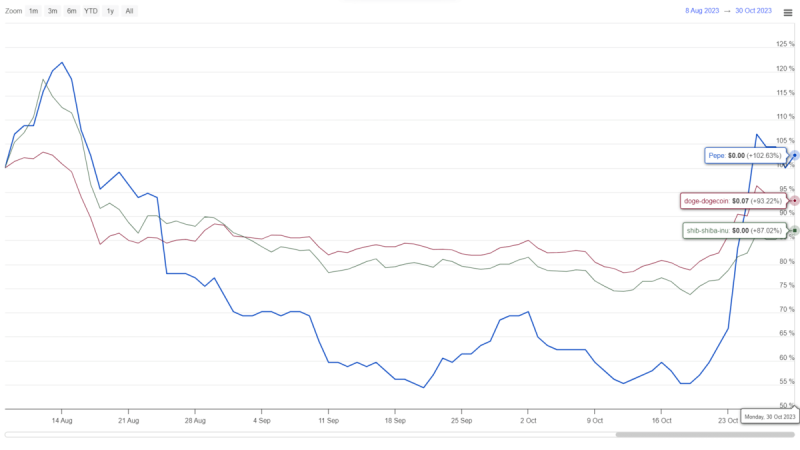
PEPE vs DOGE vs SHIB Performance

Source: Coingape| Pepecoin Vs Dogecoin Vs Shiba Inu Price
In the last three months’ price behavior, the popular meme cryptocurrencies, DOGE, SHIB, and PEPE have mostly demonstrated lateral movement. Yet, as the broader market shows signs of recovery, the Pepe coin gained significant traction in the latter part of October, successfully breaching the previous swing high resistance at $0.0000008. This places the asset in a favorable stance for additional upward movement
- Average Directional Index: The ADX currently stands at 41%, indicating that buyers may be losing momentum and suggesting that a minor pullback could be necessary to rejuvenate bullish energy.
- Exponential Moving Average: The recently reclaimed 100-day EMA, which hovers around the $0.98 price point, may serve as a robust support level during any forthcoming pullbacks.

