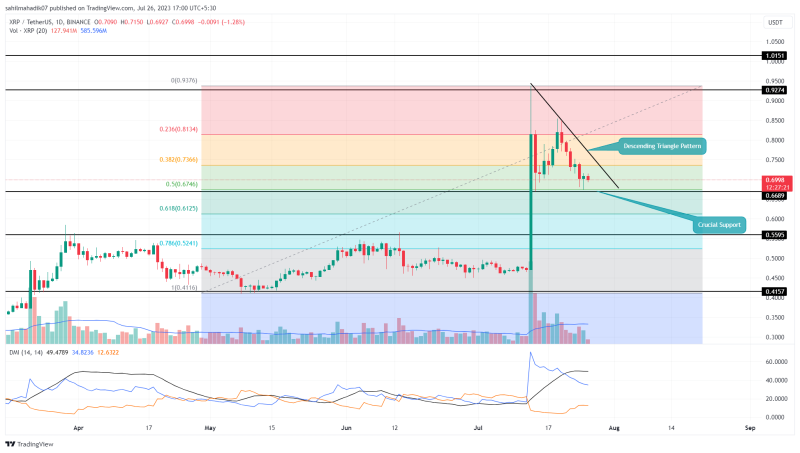
For nearly two weeks XRP price has remained in a correction phase. This retracement came after the massive rally on July 14th, where XRP price made a yearly high of $0.938. As of now, XRP is wobbling between a downslopping resistance trendline and $0.669 support, indicating the formation of a descending triangle pattern. Here’s how this pattern could further influence this altcoin of near future growth.
Also Read: XRP, DOGE Among Top Altcoins In Market Depth Spike After Ripple Ruling
XRP Price Daily Chart
- A Low volume pullback in XRP price indicates the ongoing correction is temporary.
- A bullish breakout from overhead resistance could signal the continuation of the recovery rally.
- The intraday trading volume in the XRP is $1.6 Billion, indicating a 15% loss.

Source: Tradingview
Amid the recent downturn in the crypto market, the XRP price has dropped 21% in a week and plunged to the local support of $0.669. This horizontal support aligned with the 50% Fibonacci retracement level creates a strong footing for buyers.
In the last two days, the daily chart shows candles with lower price rejections accentuating the buyers are defending their new reclaimed support. This demand pressure could trigger a bullish reversal and bolster the bulls to rechallenge the overhead trendline.
As the triangle pattern is formed in the correction phase of a larger uptrend, the XRP price is more likely to pierce the resistance trendline and resume prevailing recovery.
The post-breakout rally could revisit the last swing high of $0.927, and surpass it for the $1.015 milestone.

1 XRP to USD = $0.7035338 -0.54% (24h) TRADE

XRP

USD
Is XRP Price Poised for Longer Correction?
If the correction mode in pioneer cryptocurrency Bitcoin continues to pressurize altcoins, the XRP sellers trigger a breakdown below the $0.0669 neckline. The crackdown could accelerate the selling pressure and prolong the downward trend to $0.613, followed by $6 psychological support.
- Fibonacci retracement level: A retracement to 50% FIB level is often considered healthy for a long-term bullish trend.
- Directional moving index: the DI+(blue) and Di-(Orange) lines are gradually nearing a bearish crossover indicating increasing supply pressure in the market.


