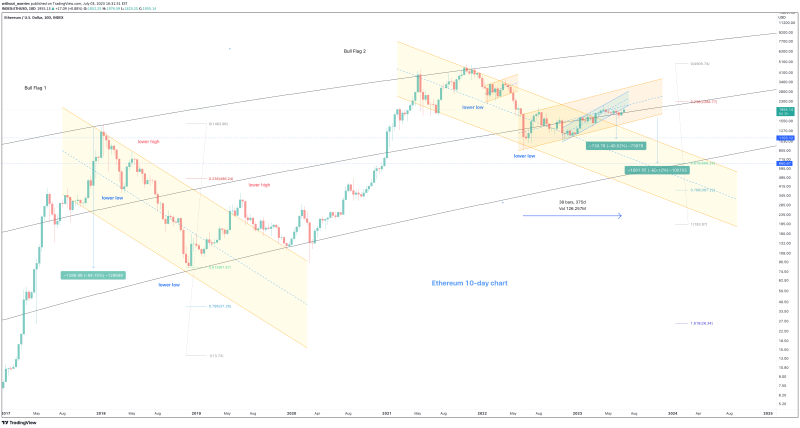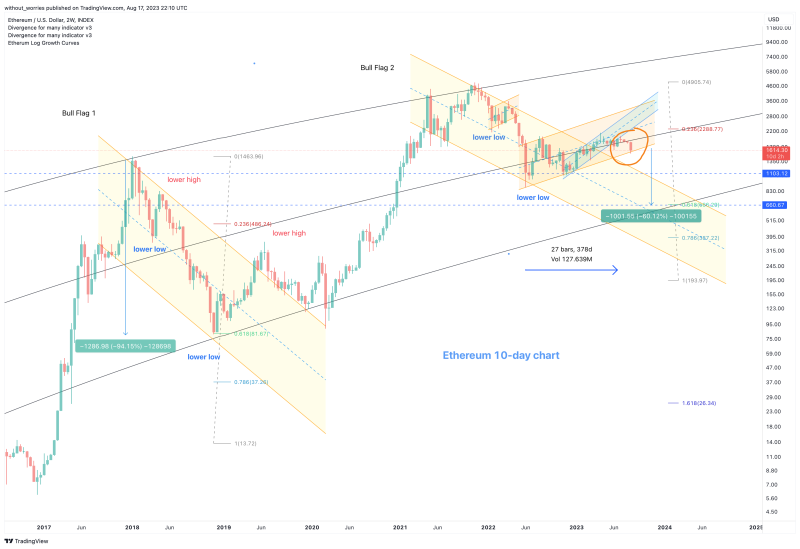
There is growing evidence for it. On the above 10-day log growth chart price action has been riding the ‘mean’ log growth line for a little over 1 year now. Throughout this whole time price action trades within an ascending channel, a bear flag. Within this bearish channel a smaller bear flag is printing.
A measured move on the smaller bear-flag confirmation would see a 40% correction in price action.
A measured move on the larger bear-flag confirmation would see a 60% correction in price action, <700 dollars. This is a fascinating level for two reasons:
1) It would be a correction to the golden ratio as was with the 2019 correction.
2) It would be a correction to the lower log growth curve, which is expected before the next bull run FOR Ethereum.
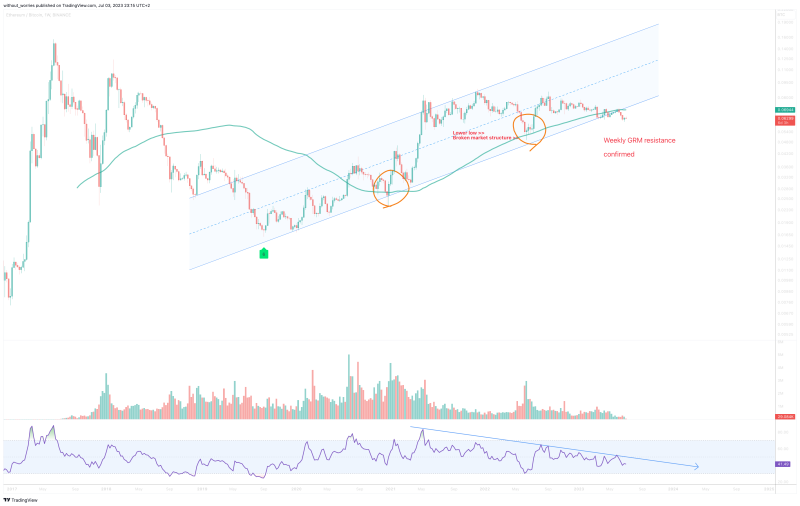
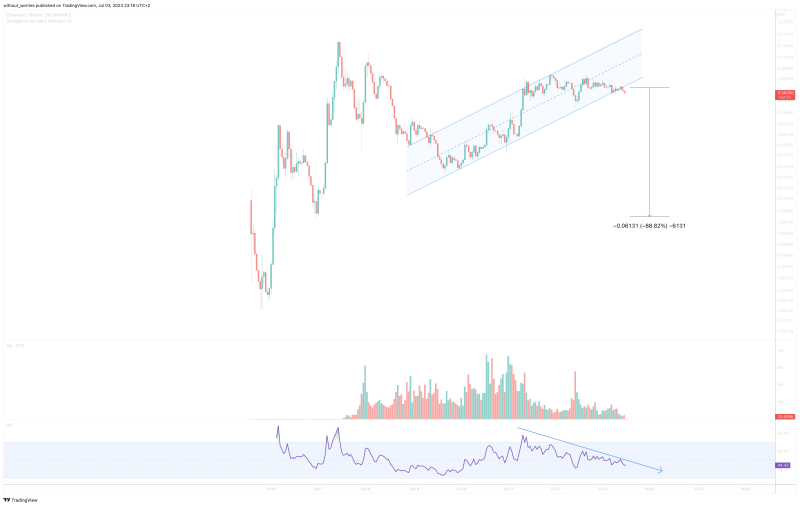
Lastly there is the Ethereum/Bitcoin chart. Two significant events:
1) The GRM (Golden Ratio Multiplier) has now failed as support (green line), a bull market requires support.
2) Price action has exited a large bear-flag.
Is it possible price action keeps rising? Sure. A convincing break of 2300-2400 would void this outlook.
Is it probable price action keeps rising? No.
For the bulls, price action must break above 2300-2400 and hold it for a 2-3 weeks.
For the bears, a correction to 1750 and under is a green light.
It is not all bad news. Would you like to Time-warp back to January 2016 and buy Ethereum for $2? It is possible and no one is talking about it. Will say elsewhere.
Ww
Weekly ETH/BTC pair.

2-week ETH/BTC large bear flag confirmation

Trade active: Broken market structure since Jul 2022. Comment: Alarms popping off all over the place.
August 28th, mark that date down. If by this time the candle body currently printing is not undone and prints the full 2-week body under the medium line, price action WILL test the bottom of the channel, circa 700 dollars depending on month.


