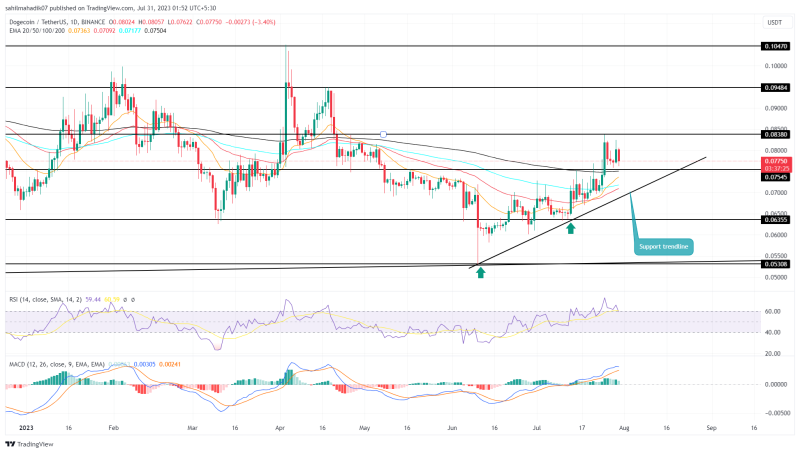
Dogecoin Price Analysis: Defying the bearish market sentiment in the crypto market the DOGE-themed memecoin continues its recovery rally to higher chart levels. With a series of new higher highs and lows, the coin price shows a sustained uptrend in the daily chart. Amid this recovery the buyers recently breached a monthly resistance of $0.075, suggesting the DOGE price could prolong the forward march.
Also Read: Launchpad XYZ Crypto Signals Telegram Group Longs Dogecoin Price, Target $0.15
Dogecoin Price Daily Chart
- An ascending trendline bolsters the current recovery for Dogecoin
- A bullish crossover between the 20-and-200-day EMAs may lure more buyers into the market
- The 24-hour trading volume in the Dogecoin coin is $458.5 Million, indicating an 8% gain

Source-Tradingview
After making a high of $0.083, the Dogecoin price reverted immediately and tried to retest the recently breached $0.754 resistance as potential support. On July 29th, the coin price bounced back from the aforementioned support with a long bullish candle indicating the buyers are accumulating at the new reclaimed support.
Today, the coin price plunged to the 0.0792 mark and showed an intraday loss of 3%. If the daily manages to sustain a hold above the half point($0.787) of the above-mentioned green candle, the coin holders would get additional confirmation of a sustained reversal.
With sustained buying, the coin buyers would rechallenge the last swing high of $0.083. A bullish breakout above this barrier would hint at uptrend resumption and may push the memecoin’s market value 21.7% to hit $0.095.
Can DOGE Price go Back to $0.635?
If the overhead supply pressure persists, the DOGE holders could witness a pullback to the rising support trendline. In the last seven weeks, the coin price rebounded twice from this support indicating a strong accumulation zone to ride the ongoing recovery. However, if sellers break this dynamic support the accelerated supply pressure could tumble the prices back to $0.635
- Exponential moving average: The coin price trading above the daily EMAs(20, 50, 100, and 200) indicates the buyers hold multiple support to maintain a recovery state
- Moving Average Convergence Divergence: A positive crossover state between the MACD(blue) and signal(orange) slope reflects the bullish momentum is active.

