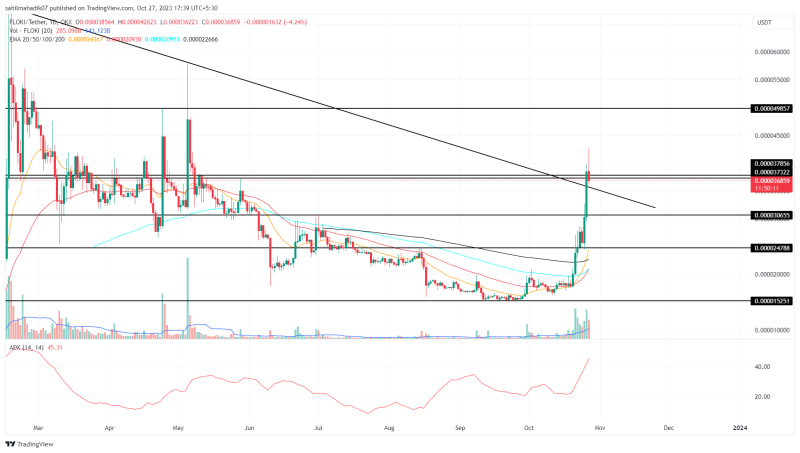
Floki Price Prediction: The Floki Coin price has certainly made its presence felt, entering the October crypto rally fashionably late but with compelling force. From its low on October 20th of $0.00001765, the asset has skyrocketed around 120% to its current trading price of $0.0000377. However, with the Bitcoin price experiencing supply pressure around the $35,000 level, questions arise about this memecoin’s ability to sustain its impressive rally.
Also Read: Price Surge After Bitcoin ETF Fake News, New Meme Coin On the Horizon Plus More..
Is Floki Price Heading to $0.00005?
- A breakout from $0.0000375 set the FLOKI price for a 32% surge
- A bullish crossover between the 50-and-100-day EMAs should boast the market buying pressure
- The intraday trading volume in the Floki coin is $364.2 Million, indicating a 105% gain.

Source- Tradingview
On the daily chart, the Floki price has captured the attention of crypto enthusiasts with a nearly vertical rally backed by a surge in trading volume. This points to strong buying interest and suggests that this rally might be more than just a flash in the pan.
Amid this rally, the coin buyers broke through some key resistance levels at $0.0000247, $0.0000365, and most recently, $0.0000378. Earlier today the Dog-themed memecoin showed a 12% rise, but the buyers couldn’t sustain this level which resulted in a minor pullback evidenced by the long tail rejection.
Despite the overhead supply pressure, if the coin price manages to close above $0.0000378, the buyers could obtain suitable support to prolong the ongoing recovery. The post-breakout rally should surge the prices another 33% higher to hit the $0.00005 psychological barrier.
Key Levels to Watch
After a massive surge, the overhead supply pressure is common as short-term traders prefer to book their profits. However, if the newfound selling pressure pushes the Floki price below $0.0000378 and the long-coming downsloping resistance, the coin holders could witness a deeper pullback before taking the next leap of recovery. According to the Fibonacci retracement tool, potential support may lie around $0.000036 (aligned with the 23.6% Fib level) and $0.000032 (the 38.2% Fib level).
- Average Directional Index: The daily ADX slope crossing above 45% suggests that the buying momentum may be reaching exhaustion.
- Exponential Moving Average: With the asset trading above key EMAs (20, 50, 100, and 200), the market conditions lean bullish.

