ETH exchange deposits have been on the rise. It could indicate that ETH is flowing from private addresses onto exchanges.


- ETH retests support levels. Evaluating the possibilities amid mixed reactions.
- ETH whales might sway the market as accumulation takes place.
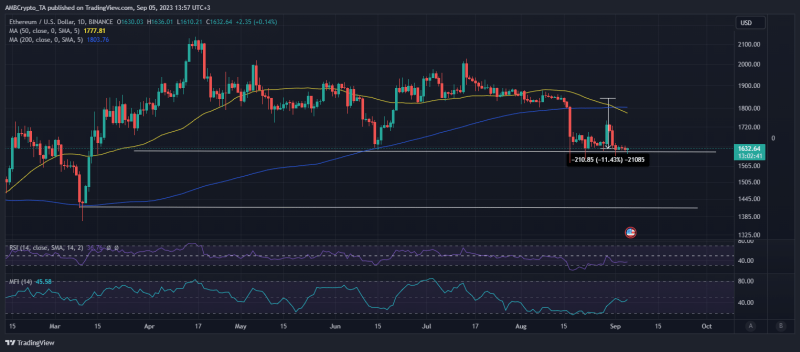
Ethereum is facing the barrel of potential capitulation all over again as the bulls struggle to secure momentum. ETH managed to restest a short-term support level again. However, it might lose that support if the bears extend their dominance.
Is your portfolio green? Check out the Ethereum Profit Calculator
ETH’s sideways price action since the start of September shared similarities with its performance in the second week of August. Capitulation followed that sideways activity, leading to an 11% downside. If a similar outcome occurred, ETH would likely push down to the next support level. This would lead to sub $1,500 price levels.

Can the bears really take over once again? That might seem unlikely considering that it was oversold in August at the same level. However, we have seen past instances wherein prices continue dipping even in oversold conditions.
A look at the latest on-chain performance may offer noteworthy insights. For example, the latest Glassnode data revealed that the number of ETH exchange deposits has been on the rise. It could indicate that ETH is flowing from private addresses onto exchanges. This is usually considered a sign of sell pressure or that investors are preparing to sell.
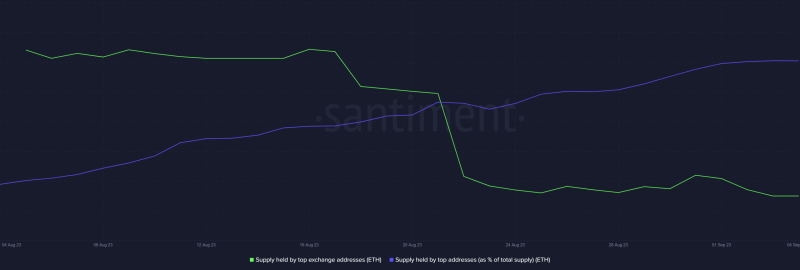
Tracing ETH exchange flows revealed that the supply of ETH held by top exchange addresses (denoted in green) remains close to its four-week lows. This coincides with the exchange deposits according to Glassnode.
Despite these findings, the percentage of ETH held by top addresses as a percentage of total supply (denoted in blue) has been growing.

Assessing the level of accumulation at the current level
ETH’s next move will depend on which is dominant between the bulls and the whales. We can determine or attempt to predict which way it will sway by observing what whales are currently doing.
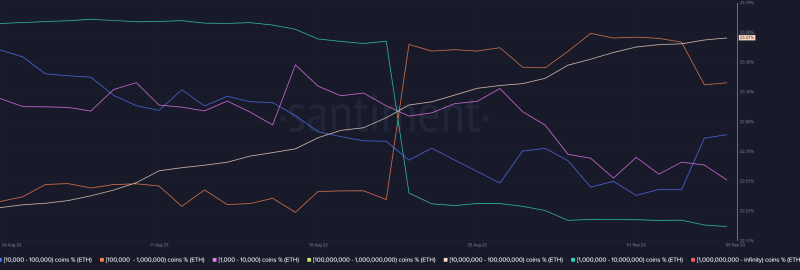
According to the supply distribution metric, some whales have been buying the dip while others are still contributing to sell pressure.

Two of ETH’s largest whale categories have been buying. These include addresses holding between 10,000 and 100,000 (denoted in blue) which have been accumulating in the last 2 days. They currently control 21.63 of ETH’s circulating supply.
Read about Ethereum’s price prediction for 2024
The larger whale category contributing to bullish momentum includes addresses between 10 million and 100 million. Addresses in this category collectively control 23.47% of ETH’s circulating supply.
This is a potentially good sign for the bulls because continued accumulation might eventually support a rally.

