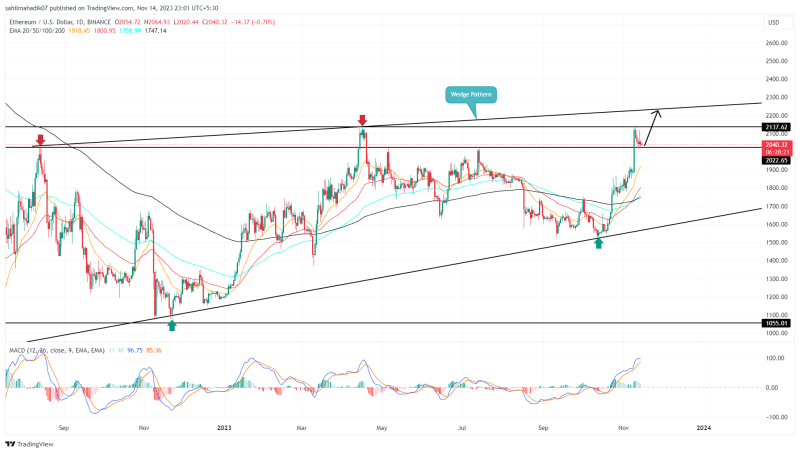
Ethereum Price Prediction: The Ethereum (ETH) coin recently experienced a significant pullback, with prices dropping 5.5% in four days to reach $2,022. This decline coincided with the Bitcoin price retracement to $36,000, raising questions about Ether’s next move: will it continue its recovery or face a new correction?
Also Read: Ethereum Network Fees Hit 4-Month With ETH Price Under Pressure, What’s Next?
Will Correction Trend Extend?
- The long-tail rejection at $2030 reflects ETH price found suitable support at this horizontal level
- The post-breakout rally may surge the price by 9% before hitting the major resistance around $2250.
- The intraday trading volume in Ether is $11.6 Billion, indicating 10% loss/

Source- Tradingview
In the past month, the Ethereum price has shown a notable recovery of 38.44%, with its price escalating from a low of $1,543 to a high of $2136. However, a closer examination of the daily chart indicates that this recovery is still operating within the confines of a rising wedge pattern.
This pattern has been guiding the ETH price movements for the past 16 months, with the coin price resonating between the converging trendlines that offer dynamic resistance and support.
Recently, as this altcoin price approached the upper trendline of this pattern, it experienced a minor pullback to $2200, likely in an effort to gather bullish momentum. If the buyers can maintain their position above the support levels of $1,222 or $1,830, there is a potential for a 9% surge from its current price, aiming for the overhead trendline around $2,240.
However, as per the past price behavior, a retest to the resistance trendline has led to increasing supply pressure and a major correction. Ideally, this pullback may extend to the $1700 mark.

1 ETH to USD = $1982.095 -4% (24h) Buy / Sell


Buy Crypto on an easy to use platform
Invest in leading cryptocurrencies such as Bitcoin, Ethereum, Cardano and more…

ETH

USD
Whale Activity Threatened for Correction
On November 14th, on-chain data provider Lookonchain on its X platform highlighted significant movements by smart money investors in Ethereum. The past week has seen several large transactions, suggesting that whales are actively engaged in the market. Interestingly, a majority of these transactions seem to be profit-taking or movements of the asset back to exchanges, potentially indicating a readiness to sell. This could increase supply pressure on Ethereum, possibly leading to a further decrease in its price
- Exponential Moving Average (EMA): The 20-day EMA slope could provide an additional slope amid the pullback phase.
- Moving Average Convergence/Divergence: A bullish crossover state between the MACD(blue) and signal(orange) accentuates the overhead market sentiment.


