Ethereum Price Prediction: Ethereum, the second-largest cryptocurrency by market capitalization, has been showcasing substantial growth throughout November. A significant boost came on the 9th of this month, as ETH price experienced a notable 12.3% intraday increase. This surge was primarily driven by news that BlackRock, the world’s largest asset management company, had filed an application for a spot Ethereum ETF. In the wake of this development, Ether reached a seven-month peak, hitting $2,130, and appears poised for further breakouts.
Also Read: BlackRock Files First Ethereum Spot ETF
Is ETH Sustainable Above $2000?
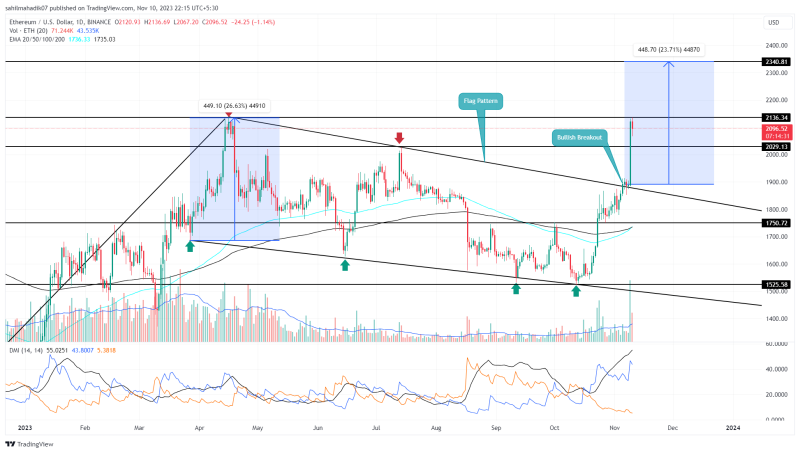
- With the supply pressure at $2136 resistance, the ETH price may witness a minor pullback
- Completion of flag pattern sets a potential target of $2340, followed by $3000
- The intraday trading volume in Ether is $20.2 Billion, indicating a 5.2% gain.

Source- Tradingview
Over the past 30 days, the Ethereum price trajectory has been impressive, climbing from a low of $1,522 to a recent high of $2,136 – a 40% increase. A key moment in this rally was on November 5th, when coin buyers successfully pushed the price beyond the resistance trendline of a bullish flag pattern.
This move led to a surge past the significant $2,030 barrier, culminating in the recent 7-month high. With strong accumulations across various Ethereum addresses and BlackRock filling applications for spot Ethereum ETF, the crypto market witnessed positive boasts among traders.
As of the latest trading sessions, the ETH price at $2,095. Although there is a slight intraday loss of 1.2%, this minor pullback might lead to revisiting the $2,030 level in search of potential support.
Should the coin price stabilize at these higher price levels, the momentum could carry it further up, potentially by another 12% to reach the $2,340 mark, aligned with the first target of the flag pattern.
Ethereum Holders in Profit

Source- intotheblock
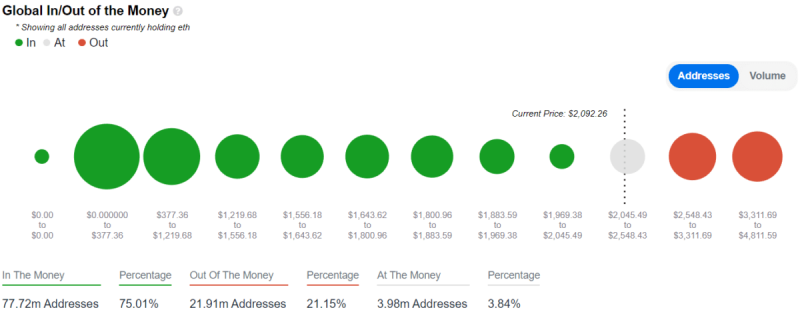
The Global In/Out of the Money (GIOM) metric for Ethereum indicates that currently, 62.13% of ETH addresses are ‘in the money’ (profiting), while 34.19% are ‘out of the money’ (at a loss). With the prevailing market recovery sentiment and a majority of holders in profit, there is a reduced likelihood of a panic sell-off, suggesting that investors might continue to support the ongoing bullish rally.
- Exponential Moving Average (EMA): The positive crossover between the 100-day and 200-day EMA slopes is likely to encourage buyers to maintain the current recovery trend.
- Directional Moving Index (DMI): The significant gap between the DI+ and DI- slopes, currently in a bullish crossover, underscores the prevailing bullish sentiment in the market

