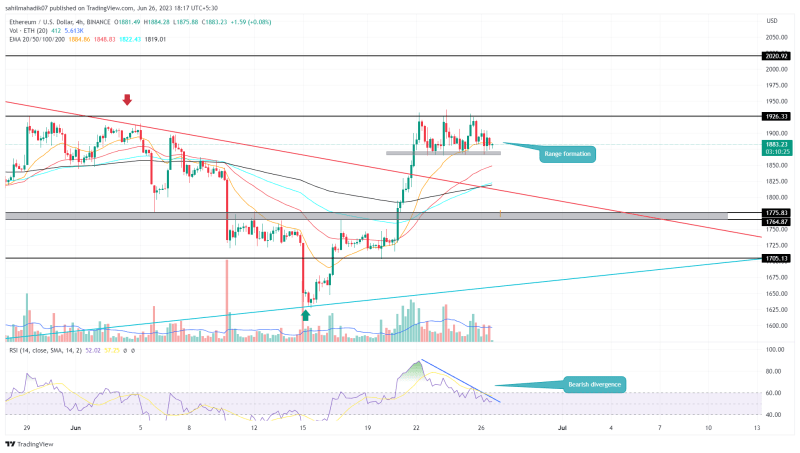
Ethereum Price Analysis: The ongoing recovery rally in Ethereum price hits a major roadblock at $1926. In the last four days, the coin price showcased three failed attempts to surpass this barrier, indicating the sellers are actively defending this level. However, the buyers have not thrown towels yet and limited the downward projection to $1867. The two horizontal levels have created a range that could influence the near future price of the ETH coin.
Also Read: Buy Ethereum on eToro, Or DCA Into Tradecurve?
Ethereum Price Daily Chart
- The range formation between the $1926 and $1867 levels can be considered as no-trading zone
- Ethereum fear and greed index at 59% reflects a positive sentiment in the market
- The intraday trading volume in Ether is $884.5 Million, indicating a 18.7% gain.

Source- Tradingview
In the 4-hour time frame chart, the Ethereum price showed a narrow range formation between $1926 and $1867 levels. The coin price has retested both the aforementioned levels at least thrice indicating an uncertain sentiment among traders.
However, despite the overhead supply, the buyers prevented a breakdown below the $1867 price level indicating the overall market trend is still optimistic. Thus, the ETH price is more likely to break overhead resistance to resume prevailing recovery.
A breakout above $1926 would replenish the bullish momentum and surge the price to immediate resistance of $2020.
Will Ethereum Price Fall Back to $1800?
The current consolidation in Ethereum price must be triggered by selling pressure generated from profit booking more short-term traders and the overall uptrend sentiment. Therefore, to avoid getting trapped in this chaos the new traders must wait for a breakout beyond this range to determine potential price movement. A possible breakdown below $1867 could plunge the price back to a recently breached trendline of $1800.
- Relative Strength Index: A falling RSI slope of a 4-hour chart reflect the increasing supply zone and potential breakout of $1867
- Exponential Moving Average: A bullish crossover between the 100 and 200 EMAs near the $1800 support would increase the support strength of this level.

