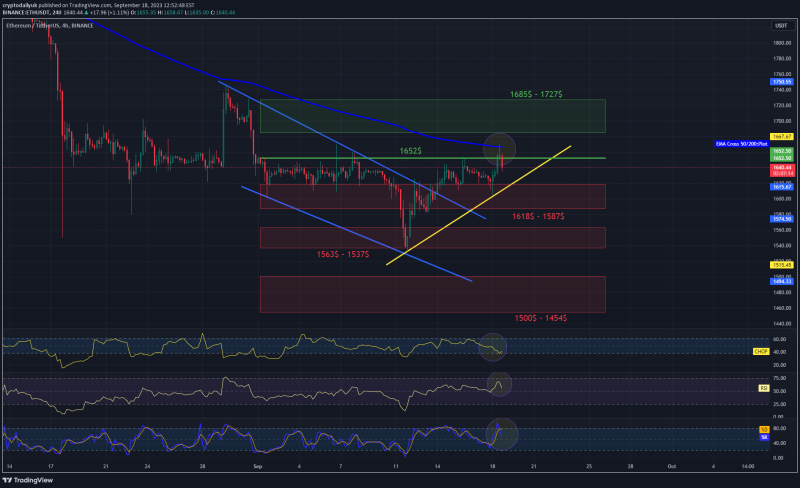
Hello everyone, I invite you to review the ETH pair to USDT chart, also on a four-hour time frame. First of all, we can use the blue lines to mark the downward trend channel from which we could see the exit from the top and we are currently moving above the local upward trend line.
However, it is worth noting that at this point it was not possible to break out of the moving average of 200, which indicates that the downward trend remains.
Now let’s move on to marking the support places. To mark supports, we will use the trend based fib extension tool, and as you can see, first we have a support zone from $1,618 to $1,587, then we will mark the second visible zone from $1,563 to $1,537, and then the third strong zone from $1,500 to $1,454.
Looking the other way, we can similarly mark places where the price should encounter resistance on the way up. And here we have the first very strong resistance at the price of $1,652, which has currently rejected the price increase, then we have to overcome a strong resistance zone from $1,685 to $1,727, only after going higher and testing this zone will we see further increases.
Index CHOP indicates that energy has been used. On the RSI, despite room for growth, the correction on BTC also had an impact on the entire market, which resulted in a price recovery, while the STOCH indicator showed energy consumption, which resulted in a quick recovery.

