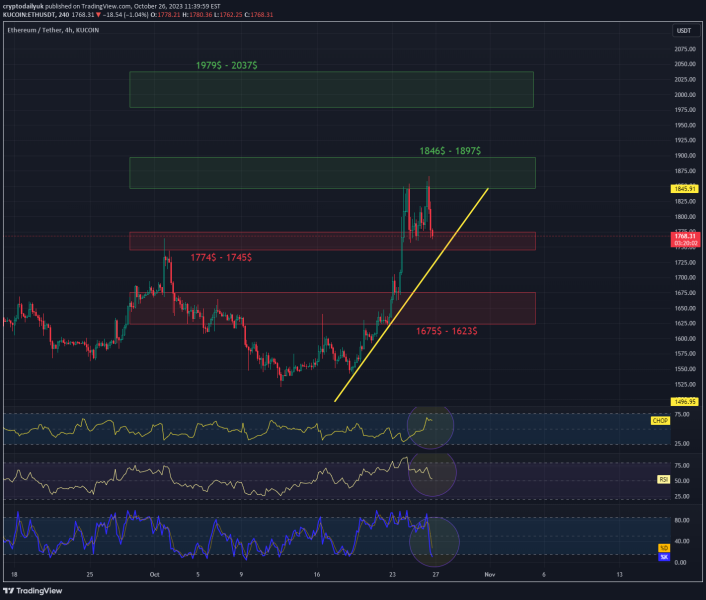
Hello everyone, let’s take a look at the ETH to USDT chart on a 4-hour time frame. As you can see, the price is moving above the local uptrend line.
When we unfold the trend based fib extension grid, we will see that the price has returned to the support zone from $1,774 to $1,745, but if the support does not maintain the price, we still have a second zone from $1,675 to $1,623.
Looking the other way, we can see a fight with a strong resistance zone from $1,846 to $1,897, while we still have a second strong zone from $1,979 to $2,037.
Looking at the CHOP indicator, we see that the energy has been restored, the RSI shows a visible recovery with room for further decline, but the STOCH indicator is approaching the lower limit, which may limit the declines and result in another price increase.

