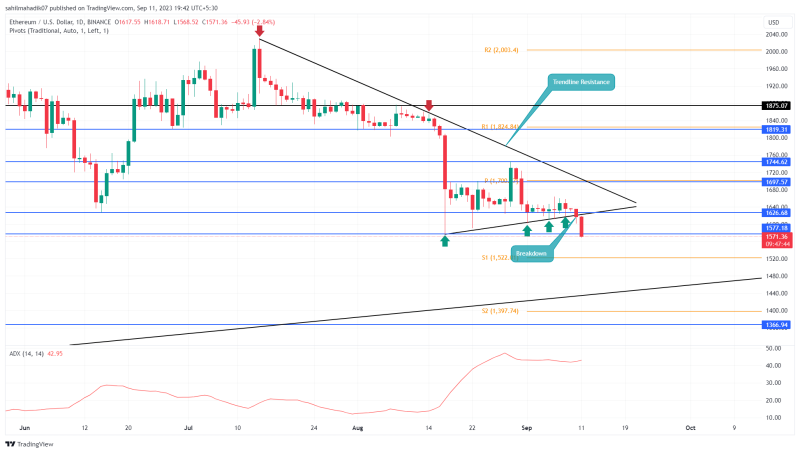
In recent times, the altcoin space has witnessed increased selling pressure, resulting in a cascading wave of corrections across most tokens. Ethereum, the second-largest cryptocurrency by market capitalization, hasn’t been spared either. Over the last four days, it’s faced a continuous slip, drifting from a high of $1,558 to a pit at $1,577, marking a 5.2% descent. This plunge not only wiped off recent gains but also pushed Ethereum beneath a pivotal support level, signaling the potential for even deeper corrections ahead.
Also Read: Top Analyst Predicts Ethereum Price Prediction Before Bitcoin Halving
$1570 Support Breakdown Hints Further Downfall
- A bearish breakdown below $1570 will set the ETH price for a 7% drop
- A potential negative crossover between 100-and-200-day could accelerate selling pressure in the market
- The intraday trading volume in Ether is $7.3 Billion, indicating an 181% gain.

Source- Tradingview
For a notable span of three weeks, the Ethereum price confidently rode above the $1,600 psychological mark. This was primarily buoyed by ascending support trendlines which served as its safety nets. Every time the price took a dive toward this region, it was met with a brisk buying spree, to carry a relief rally.
However, with a domino effect stemming from the recent altcoin shed, Ether coin’s value was jolted down by 1.1% on September 10th. This sent it crashing through the aforementioned support trendline. Adding to the bearish motive, the coin price plunged 2.8% providing a suitable follow-up to the trendline breakdown.
If this bearish drive holds its course, this altcoin might crumble below the August 17th low of $1,576, a definitive testament to the downtrend’s grip. Should this bearish trajectory linger, ETH price may witness a steeper drop, eyeing a target of $1,450 – a decline of approximately 8.5%.

1 ETH to USD = $1580.596 -0.93% (24h) Buy / Sell


Buy Crypto on an easy to use platform
Invest in leading cryptocurrencies such as Bitcoin, Ethereum, Cardano and more…

ETH

USD
$1570 Support Breakdown Hints Further Downfall
A cursory glance at Ethereum’s price behavior over the preceding three weeks reveals this entire consolidation phase has been bounded with the August 17th daily candle. This candlestick high and low – at $1,809 and $1,576 respectively – have now morphed into formidable resistance and support barriers. Yet, given the prevailing bearish winds, any descent below the $1,570 threshold could spell an avalanche of selling pressure, further suppressing the ETH price.
- Bollinger Band: The lower boundary of Bollinger Band is challenged to indicate the current selling pressure is aggressive.
- Average Directional IBOndex: The ADX slope at 43% reflects that the sellers may soon exhaust from the over-extended downtrend.


