
Bitcoin’s key levels on the charts might dictate where its price goes next.

Edited By: Jibin Mathew George
- Support area at $95k, where a high number of traders entered, led to uptrends upon retests
- Net volume of Taker orders shrunk to a minimum as Funding Rate stayed consistently positive
Bitcoin’s (BTC) trading activity highlighted a heightened participation ratio, one that signaled $95,000 as a key support area. Here’s where a significant influx of traders entered the market.
This zone consistently led to an upside on the charts after retests, confirming its role as a strong support level. At the time of writing, Bitcoin was valued at around $97,505 following marginal gains of +0.19%.
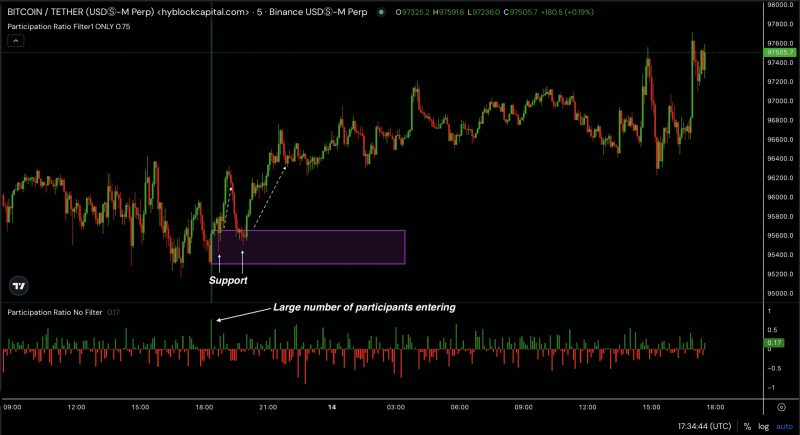
This finding suggested that following support confirmation, BTC may continue its uptrend. However, future movements will depend on market dynamics and participant responses at these levels.
These observations may provide traders with insights into potential resistance or support zones and their potential impact on price trends.
Bitcoin’s symmetrical triangle breakout
Following this rally, Bitcoin broke out from a symmetrical triangle on the charts. The breakout move rose to the price point of $98,439.50. The symmetrical pattern hinted at uncertainty, but it typically resolves in the direction of the previous trend, which, in this case, was bullish.
Initially, Bitcoin touched the lower boundary of the triangle and rebounded to break the upper boundary, suggesting a test of resistance around $99,000. If BTC breaks above this level, it could signal a continuation of the bullish trend, potentially challenging the $100,000-mark.
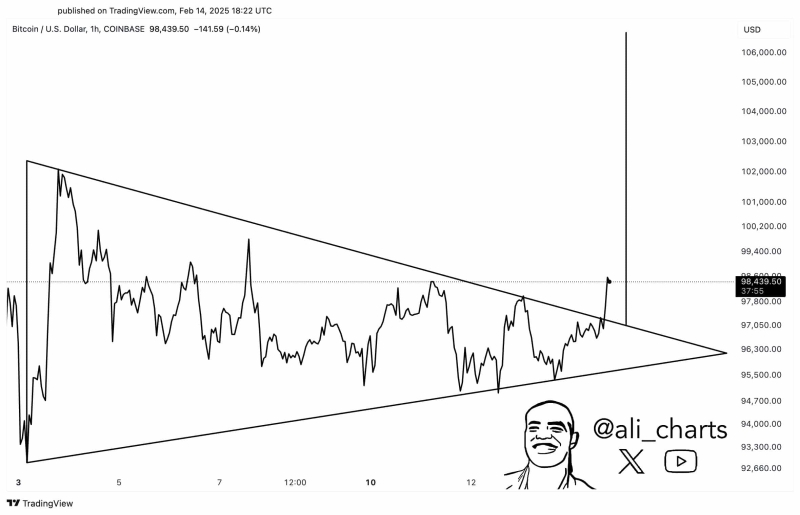
Conversely, a break below the triangle’s support around $95,500 could lead to a retest of lower support levels near $92,660 or even lower.
Net Taker and Funding Rate
Over the past two weeks, net taker volume significantly fell, indicating a reduction in aggressive market entries, particularly short positions. Such a decline aligns with a consistently positive funding rate – A sign that those holding long positions are willing to pay to keep them, likely in anticipation of higher prices.
The price of Bitcoin underlined a stable trend within this period, with the crypto maintaining its levels around the $99k-level. This stability, coupled with reduced short selling and positive funding rates, may imply underlying strength in the market.
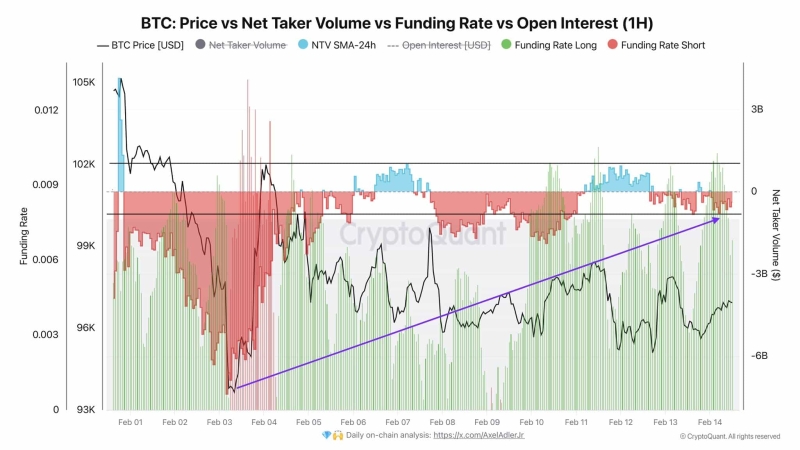
The uptrend in Open Interest hinted at increasing engagement despite the price stagnation, which could be seen as a buildup to a potential price breakout. Given these factors, the outlook for Bitcoin could be cautiously optimistic.
If trader participation continues to increase without a corresponding hike in short selling, Bitcoin could potentially test higher resistance levels. Conversely, a sudden hike in short selling or a negative shift in funding rates could push the price south.