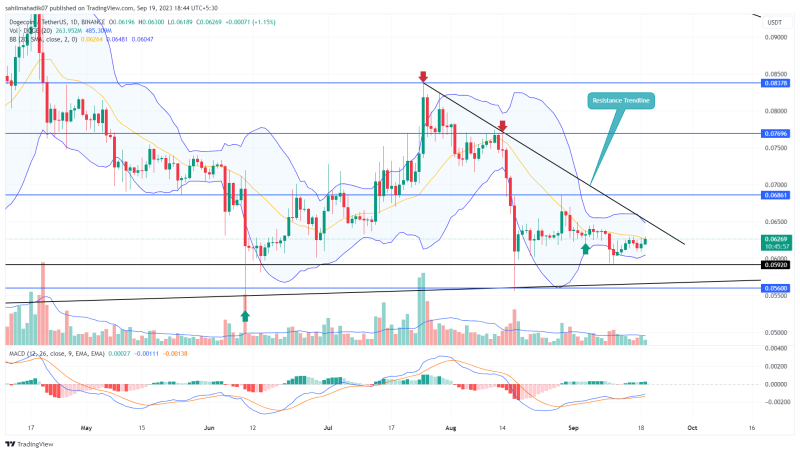
Since last month, the Dogecoin price dynamics have predominantly exhibited a lateral trend, culminating in a tight range on the daily chart. Despite the turbulence observed in the broader crypto market, fluctuations in this memecoin have adhered to the bounds set by the August 17th daily candle, earmarking the high at $0.0684 and the trough at $0.0545 as salient resistance and support points respectively. Here’s how this rectangle pattern could trigger a directional rally in the near future.
Also Read: DFS Excludes XRP and DOGE from NY Crypto ‘Greenlist’
Key Resistance Breakout Hints a 7% Jump?
- The DOGE price may witness suitable demand pressure at the $0.06
- The $0.0684 breakout could bolster DOGE for sustained recovery.
- The 24-hour trading volume in Dogecoin is $201.5 Million, indicating a 47% loss

Source-Tradingview
As the broader crypto market radiates an air of recuperation, the DOGE prices experienced a bounce back from the $0.06 support on September 11th. This bullish pivot fueled a commendable 5.76% price ascension over a fortnight, catapulting the cryptocurrency to its currency trading price of $0.0626.
In the wake of continued bullish sentiment, the traders are now on the cusp of challenging an overhead resistance trendline wavering around the $0.064 mark. This resistance has wielded its influence over this memecoin’s trajectory for a duration of nearly two months, hence a breach of this level could be instrumental in amplifying the bullish momentum.
Overcoming this hurdle may surge the prices by 7% higher to grapple with the range barrier of $0.0684. A breakout above this barrier would be a better signal of sustained recovery.

1 DOGE to USD = $0.0628712 0.71% (24h) Buy / Sell


Buy Crypto on an easy to use platform
Invest in leading cryptocurrencies such as Bitcoin, Ethereum, Cardano and more…

DOGE

USD
Is DOGE Price Heading Back to $0.056?
if the overhead supply of the downsloping resistance remains unyielding, the Doge valuation might confront a downturn from the $0.064 benchmark. A potential rebuff at this juncture might force the coin’s price beneath the local support of $0.06 potentially paving the way for an additional descent of approximately 5%, targeting the lower boundary of the range at $0.056
- Bollinger Bands: An uptick from the lower band of the Bollinger band indicator should offer traders additional support.
- Moving Average Convergence Divergence: The rising MACD indicator reflects increasing bullish momentum at lower levels.


