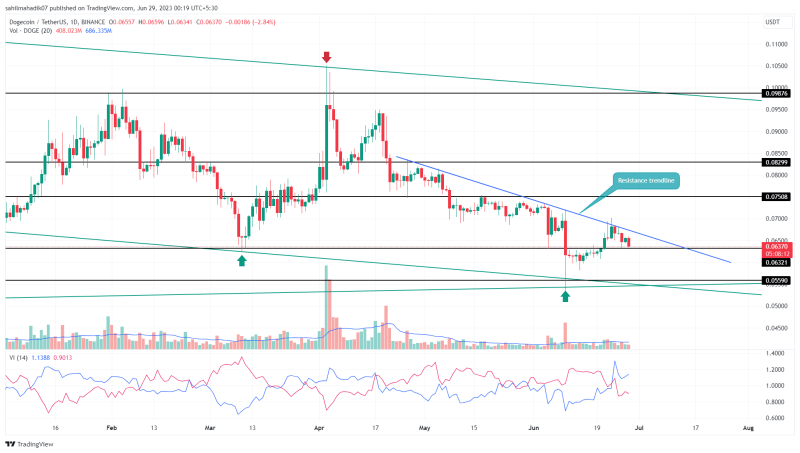
Dogecoin Price Analysis: The recent recovery rally in Dogecoin price failed major resistance at a downsloping resistance trendline. This falling trendline has carried a downtrend for nearly two months, undermining the buyer’s attempt to establish a sustained bullish recovery. A recent reversal from the dynamic resistance indicates the DOGE price is poised for further downfall.
Also Read: Dormant Dogecoin Address Finally Reawakens, is a Dump Incoming
Dogecoin Price Daily Chart
- A breakout above the overhead trendline may kickstart a new recovery cycle.
- The downsloping 100-and-200-day reflects a steady downtrend
- The 24-hour trading volume in the Dogecoin coin is $203.3 Million, indicating a 13% loss.

Source-Tradingview
On June 24th, the dogecoin price faced another bearish reversal from the downsloping trendline, which recuperates the selling momentum in traders. In the last five days, the dog-themed memecoin plunged 6% to reach the immediate support of $0.0632.
By the press time, DOGE price trades at $0.064 and faces demand pressure at the aforementioned support. With this newly obtained support, the coin may consolidate in a narrow range before giving an explosive move.
For the coming days, the overhead trendline and $0.063 may create a no-trading zone.
Therefore, if the sellers plunge $0.0632, the bearish momentum will intensify which could plunge the price 12% to hit the next significant support of $0.0599.
Will Dogecoin Price Kickstart a New Recovery?
If the market sentiment returns to the recovery track, the Dogecoin price could show a bullish breakout from the overhead resistance. This breakout may flip the traders’ mindset from actively selling on rallies to buying on dips. Thus, the flipped support could bolster buyers for further recovery and may drive the price to the next resistance of $0.75.
- Exponential Moving Average: The 50-day EMA dynamic resistance offers additional resistance against buyers
- Vortex Indicator: A VI+ slope higher than the VI- slope reflects bullish momentum is intact.

