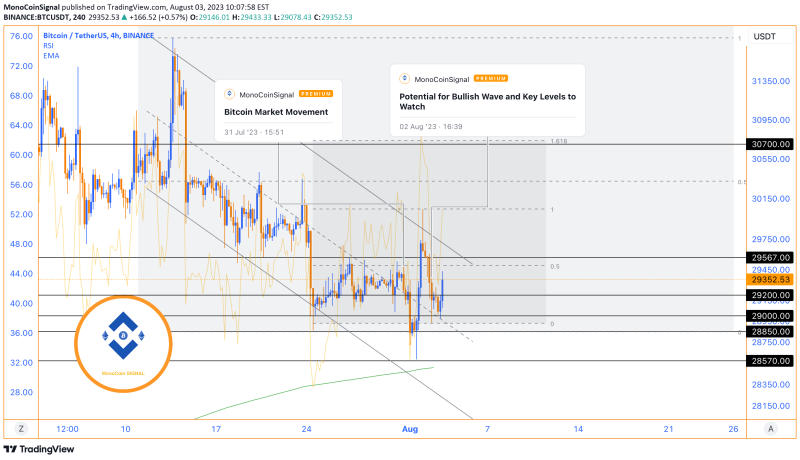
In the course of the last day, Bitcoin’s price correction has progressed unabatedly, reaching the critical level of $29,000. During this period, a notable decrease in selling pressure was observed as Bitcoin managed to break through the supportive boundary of the downtrend line. Interestingly, the corrective 0.50 Fibonacci support did not incite a substantial reaction, leaving the Bitcoin price to correct almost to the starting point of its prior upward trajectory.
Taking a more comprehensive view of the situation, a potential for an additional bullish wave could be considered, provided that the lowest point of the two previous day’s candles at the price of $28,570 isn’t breached. However, it is essential to note that due to the in-depth correction observed recently, any forthcoming upswing may not manage to surpass the resistance level of $30,700. This implies that the strength of the next bullish wave might be somewhat diminished compared to previous trends, lending a more cautious outlook for the near future.
This analysis demonstrates the importance of closely monitoring the performance of Bitcoin’s price relative to significant levels of support and resistance. Additionally, it highlights the potential short-term and medium-term market developments based on the current technical indicators. As always, any trading decisions should be made in consideration of the inherent risks involved in the dynamic cryptocurrency market.
Note: The RSI (Relative Strength Index) for Bitcoin stands at 53, which indicates a somewhat neutral territory. This figure does not suggest an overbought or oversold condition, implying that the market sentiment is relatively balanced.
On the other hand, the MACD (Moving Average Convergence Divergence) is at -14.5, signaling a bearish trend. This negative value means that the short-term momentum of Bitcoin is weaker than its long-term momentum. Therefore, traders should be aware of potential continuing downtrends in the short term.

