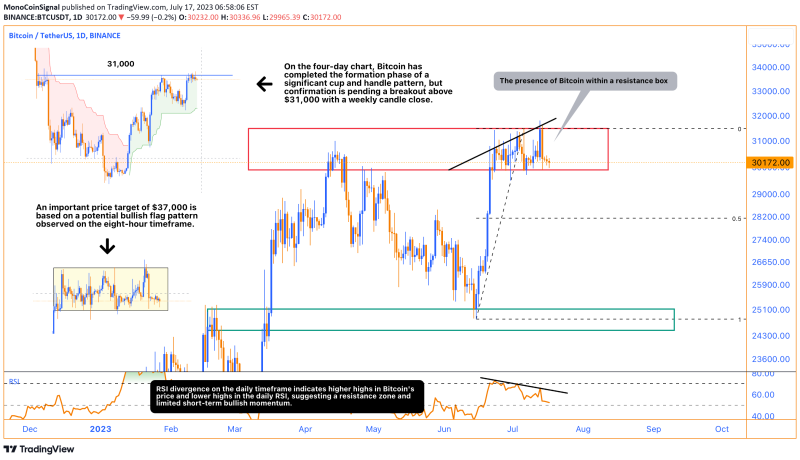
On the four-day chart, Bitcoin has completed the initial formation phase of a significant cup and handle pattern. However, it is important to note that the pattern has not been confirmed yet. To validate the pattern, we need to see a breakout above the approximately $31,000 level, accompanied by a weekly candle close above that threshold. Currently, this level serves as a strong resistance that should be closely monitored.
Analyzing the daily timeframe, we observe a confirmed RSI divergence. This is evident from the higher highs in Bitcoin’s daily closing prices, juxtaposed with the lower highs in the daily Bitcoin RSI. Considering the presence of Bitcoin within a resistance box, it is unlikely to exhibit bullish momentum in the short term. Instead, we can expect further sideways price action, similar to what we have observed in recent weeks. If Bitcoin returns to the lower end of the resistance range, it could alter the movement of the RSI and potentially initiate an upward trend.
Regarding the daily Bitcoin MACD, there have been minimal changes in the past day. As of now, it indicates low momentum in the shorter term. However, it is important to note that the technical outlook is currently leaning slightly more towards a bearish stance than a bullish one, with limited momentum evident.
If a conclusive breakout above the 31,000 level is confirmed, the subsequent Fibonacci extension target is estimated to be around $37,000. However, to establish genuine confidence in a breakout, it is essential to witness a weekly candle close well above $31,000.
The significance of the $37,000 price target stems from a potential bullish flag pattern observed on the eight-hour timeframe.

