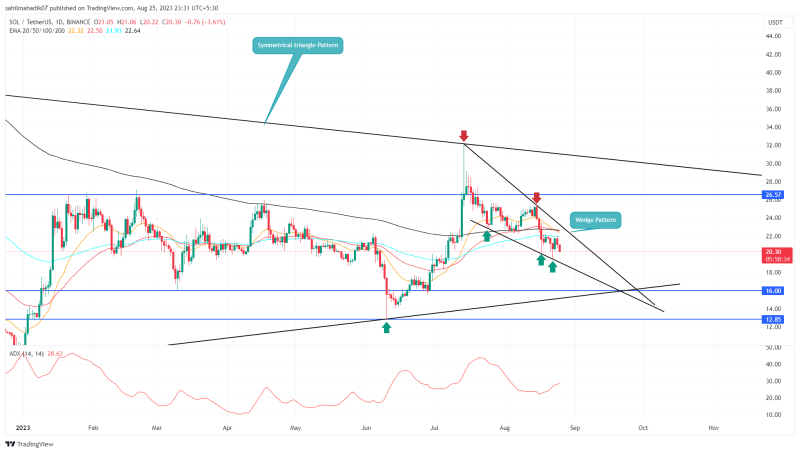
Over the last six weeks, the Solana coin has undergone a notable correction phase. Commencing from its peak at $32.13, the cryptocurrency’s value has declined 36.8%, leading to its present trading price of $21.39. This retracement has fallen below the 50% level of the June-July recovery level hinting bearish momentum is aggressive which could lead to further downfall. However, the falling price has shaped into a falling wedge pattern which could significantly influence the future trend.
Also Read: Shopify Enables Solana (SOL) Pay
Solana Daily Chart: Key Points
- The Solana price rebounded several times from a wedge pattern reflecting its strong influence on market participants.
- A death crossover between the 50-and-200-day EMA may intensify the selling momentum
- The 24-hour trading volume on the Solana coin is $280.9 Million, indicating a 24.3% gain.

Source-Tradingview
A falling wedge pattern is characterized by converging trendlines that slope in a downward direction, forming a wedge-like shape. The chart pattern signifies a potential shift in market sentiment from bearish to bullish, as the price range between the two converging trendlines gradually narrows over time.
By the press time, the SOL Price trades at $20.37, with an intraday loss of 3.28%. The falling price soon retests the lower trendline which puts demand pressure for a bullish upswing. A potential recovery with this pattern will lead the prices to the overhead trendline or near the $21.55 mark
However, until these two trendlines are intact this ninth-largest cryptocurrency may prolong the downward trendline potential falling to the $16 mark.
Will SOL Price Recover to $30?
Though the nature of the wedge structure showcases a downward leading set up, the common outcome of the pattern is a bullish reversal after the price breaks the above trendline. Therefore, the inverted market participants can wait for an overhead resistance breakout which leads to a recovery rally to $25.5 or $30.
- Exponential Moving Average: The coin price trading below daily EMAs(20, 50, 100, and 200) indicate the path to least resistance is downward
- Average Directional Index: An uptick in the daily ADX slope near the 28% mark reflects the sellers’ having enough strength to lead a longer downtrend.

