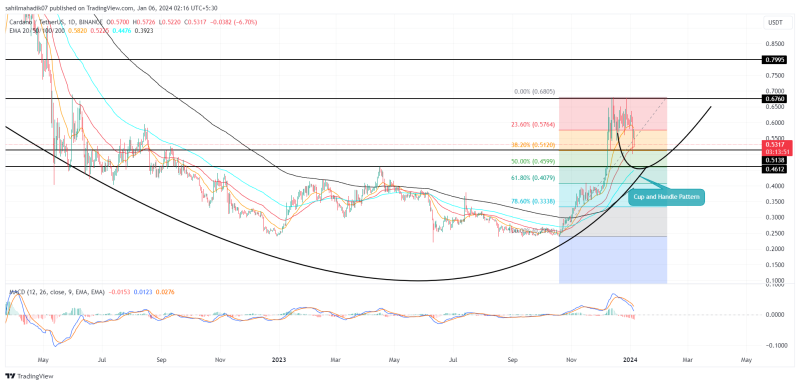
Cardano Price Prediction: Amid the increasing uncertainty in the crypto market, the Cardano(ADA) recovery rally witnessed a renewed supply pressure at the $0.676 mark. As sellers strengthened their grip amid speculation that the US SEC may reject the approval of the Spot Bitcoin ETFs, the ADA price plunged back to the $0.5 mark. Will this psychological support act as a springboard for higher recovery or correction may prolong lower?
Will ADA Price Prolong Correction Beyond $0.5?
- A confluence of technical support at $0.5 creates a high area of interest for buyers.
- A cup and handle pattern leads the broader recovery trend in ADA
- The intraday trading volume in the ADA coin is $628 Million, indicating a 5.1% gain

Cardano Price Prediction| TradingView Chart
The Cardano price recovery entered a new correction in December end when the price reverted from the $0.676 mark. Within two weeks, the altcoin’s value tumbled 22.8% to currently trade at $0.529.
On January 3rd, the crypto market witnessed a sudden sell-off as Matrixport in a recent report shed light on the likelihood that the U.S. Securities and Exchange Commission (SEC) may reject the proposal for spot Bitcoin Exchange-Traded Funds (ETFs).
Despite this downturn, the ADA price showed a long-tail rejection on Wednesday indicating the buyers are accumulating at $0.5 which coincides with the 38.2% Fibonacci retracement level. Such a degree of pullback reflects a health retracement allowing the price to sustain higher levels.
Thus, a bullish reversal sign at this crucial support could signal a favorable opportunity to buy the dip. The post-correction rally could lead a price back to the last swing high of $0.676, registering 28% growth potential.
Anyways, a breakout beyond this overhead barrier would give a better signal for uptrend continuation.
Will the ADA Price Rise to $0.8?
In the daily time frame chart, the ADA price shows the formation of a cup and handle pattern. Concerning this pattern, the current retracement is developing a handle portion, which is a minor pullback to recuperate the exhausted bullish momentum before the next jump. Thus, a breakout above $0.676 would trigger this pattern, signaling an early sign of trend reversal. Under a favorable bullish scenario. This breakout could lead a rally to $0.8.
- Moving Average Convergence Divergence: A wide gap between the MACD and the signal line in a bearish crossover state indicates an active correction trend in the market.
- Exponential moving Average: The 50-day EMA slope at $0.5 provides additional pullback support to buyers.
Related Articles:
- Cardano Price Prediction: Will ADA Surge Amid Expectations Of Remarkable Growth In 2024
- Bitcoin ETF: How Likely Is US SEC To Give Early Approval?
- Where Will Bitcoin Price Head in January 2024, $50k or $35k?

