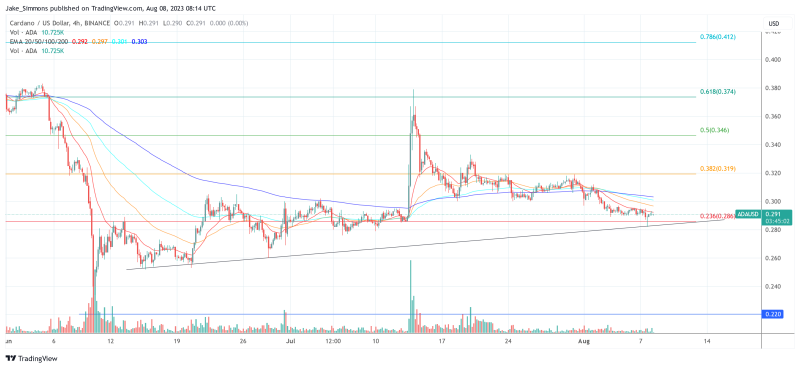
Cardano (ADA) is currently trading at a pivotal $0.291. The question is: Will ADA experience a 28% upswing or is a 23% drop on the horizon? Remarkably, the ADA price still remains in bearish territory, but the potential for a trend reversal is palpable.
Price Analysis: 4-Hour Chart
The 4-hour chart paints a picture of ADA trading just a smidge above the 23.6% Fibonacci retracement level, which stands at $0.286. Notably, on Monday, ADA briefly dipped below this level but was buoyed by the ascending trend line (black line) that was established in mid-June. This trend line is the bulls’ last stand; a breach could see a bearish descent to the year’s low of $0.22.
Adding another layer of complexity, the 200-EMA (blue line) on the 4-hour chart is converging towards the 23.6% Fibonacci level. ADA’s recent inability to surpass the 20-EMA (red line) is concerning. With the moving averages trending downward, a compression between $0.28 and $0.30 seems inevitable.

However, if ADA remains resilient above the 23.6% Fibonacci retracement level and the trendline, and manages to break the moving averages, especially the 200-EMA, then the bulls might just have a fighting chance.
In this scenario, the 38.2% Fibonacci at $0.319, the 50% Fibonacci at $0.346, and the 61.8% Fibonacci at $0.378 become the next logical targets. A daily close above $0.38 (July’s high) would be a clarion call for the bulls, marking a 28% rallye from the recent price.
Bullish Arguments for Cardano
The recent price movements by Cardano might be bearish, but there are compelling arguments in favor of ADA’s potential resurgence. Santiment, a renowned analytics platform, recently tweeted:
State of @Cardano Q2 2023
With a dedicated community of users and developers, Cardano has demonstrated staying power.
In Q2, average daily dapp transactions were up 49%, TVL up 10%, and 199% YTD.@redvelvetzip dives in. https://t.co/MNhyNJvIPq
— Messari (@MessariCrypto) August 4, 2023

