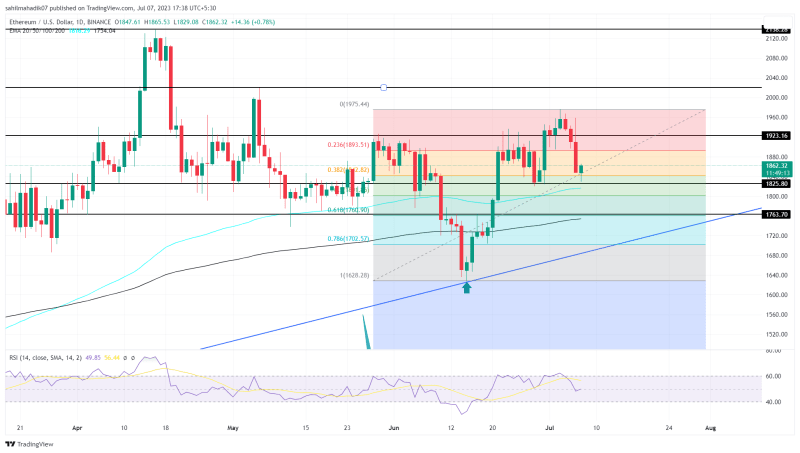
The Ethereum (ETH) price experienced a significant downturn this week, breaching the recently reclaimed monthly barrier of $1922. This decline signaled a failure to sustain a higher price, potentially leading to further selling pressure. Adding to the negative sentiment were concerns about the US Federal Reserve’s tightening policies. As a result, ETH witnessed a 5% drop over the last two days, reaching a low of $1825.
Also Read: Ethereum Price Prediction As Dips Become Profitable: Rebound To $2k In The Offing?
Ethereum Price Daily Chart
- The ETH price plunged below the $1922 flipped support, signaling a potential bull trap and triggering selling pressure.
- Healthy retracement could pour more buying orders at $18250 support
- The intraday trading volume in Ether is $8.7 Billion, indicating a 31% gain.

Source- Tradingview
On June 5th, the Ethereum price plunged below the flipped support of $1922, indicating a potential bull trap. This development led to increased selling sentiment among investors, further pressuring the ETH price.
As a result, the altcoin experienced a 5% drop in just two days, reaching a low of $1825. However, this support level aligned with the 38.2% Fibonacci retracement level provided a temporary pause in the falling prices, indicating a potential area where buyers might step in.
A retracement to the 32.2% FIB is still considered healthy for the overall trend and therefore, the second-largest cryptocurrency is in a bullish trend. If the coin price shows sustainability above $1825 this week, the buyers could rebound and challenge the $2000 mark.
Will Ethereum Price Witness Long Correction?
If the selling pressure continues and breaches $1825 support, the sellers will likely prolong the downfall in ETH price. In such a scenario, the coin holders could see a potential 7% decline to reach the long-coming support trendline. The support trendline represents a historically significant level where buyers have shown interest to accumulate dips.
- Exponential Moving Average: The 100-day EMA slope near $1825 increases the support strength of this level.
- Relative Strength Index: The daily-RSI slope at 50% reflects a neutral sentiment among traders.

