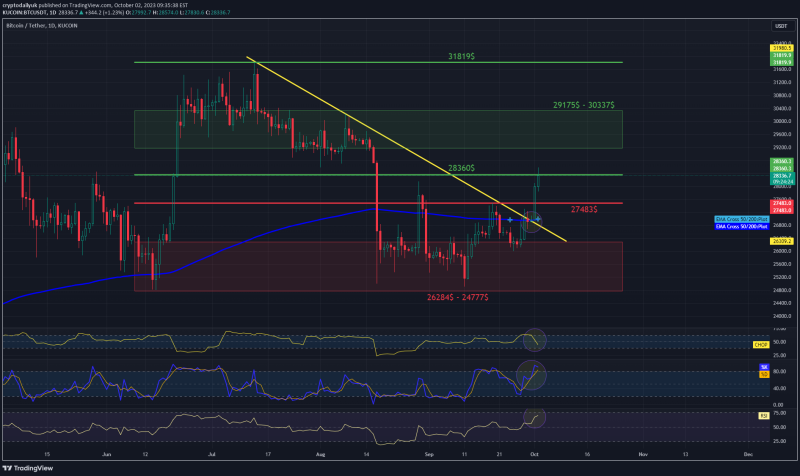
Hello everyone, I invite you to review the current situation of BTC in the USDT pair, taking into account the one-day time frame. First, we will use the yellow line to mark the downward trend line and, as we can see, the price has moved upwards from this line, and we can also see that in the same place the price has broken the blue EMA Cross 200 line, which indicates a return to the upward trend.
Now we can move on to marking support areas in the event of a correction. And here, after unfolding the Fib Retracement grid, we first have support at the level of $27,483, and then we need to mark a very strong support zone from $26,284 to $24,777.
Looking the other way, we can determine resistance areas in a similar way. First of all, we will mark the resistance that the price is currently struggling with at the level of $28,360. As you can see, at the moment the price has returned to this level, only when it is positively tested will it move towards the resistance zone from $29,175 to $30,337. and then we have strong resistance at $31,819.
Please pay attention to the CHOP index, which indicates that most of the energy has been used, the STOCH index also exceeded the upper limit, which resulted in the inhibition of the upward movement, but the RSI index shows an increase, but with room for the price to go further, which is worth taking into account .

