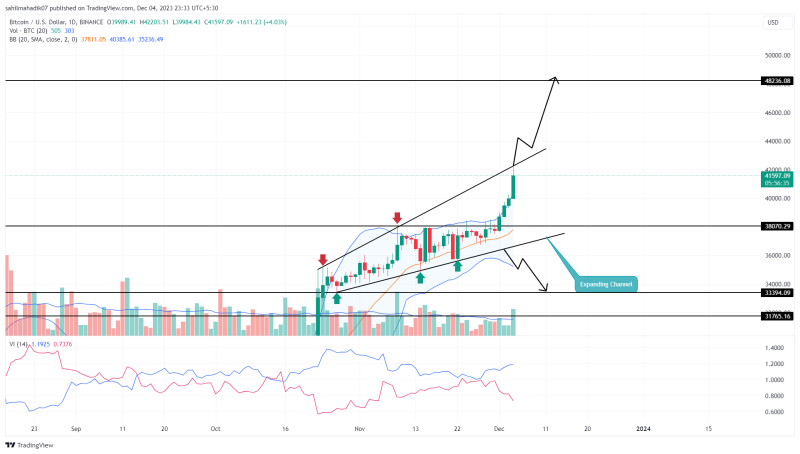
Bitcoin Price Prediction: After witnessing uncertainty for the major portion of November, the Bitcoin price started picking up momentum in the last week. Starting from $35,682 low the recovery surged 17.12 to reach a current trading price of $41,743. However, a look at the technical chart shows this upswing is still confined within an expanding channel pattern, which could significantly alter the near future trend.
Also Read: Recession 2024 Fears: Bitcoin vs Gold Set For An Epic Battle This Time
Is BTC Heading to $50000?
- The BTC price rising for four consecutive days with a substantial increase in volume indicates sustained recovery
- The expanding channel pattern leads to the current recovery trend.
- The intraday trading volume in Bitcoin is $36.9 Billion, indicating a 101% gain.

Bitcoin Price Prediction | TradingView Chart
In the last seven months, the Bitcoin price trajectory has been characterized by a gradual yet consistent recovery, guided by a rising expanding channel pattern. The repeated rebounds from the two ascending trendlines of this pattern underscore its significant impact on market participants.
Notably, on November 22nd, Bitcoin experienced a reversal from the lower trendline, leading to a robust recovery that touched a 19-month high of $42,200 at the upper trendline. Historical observations of this pattern indicate that reaching the upper trendline often triggers increased selling pressure, typically resulting in a reversion back to the lower trendline.
However, it’s important to note that this pattern generally signifies growing market uncertainty, as evidenced by the large price swings within the pattern. Therefore, a breakout above the pattern’s upper trendline would be a more convincing indicator of a strong recovery, potentially driving the price up by 15% to reach around $48,175, and possibly extending to the $50,000 mark
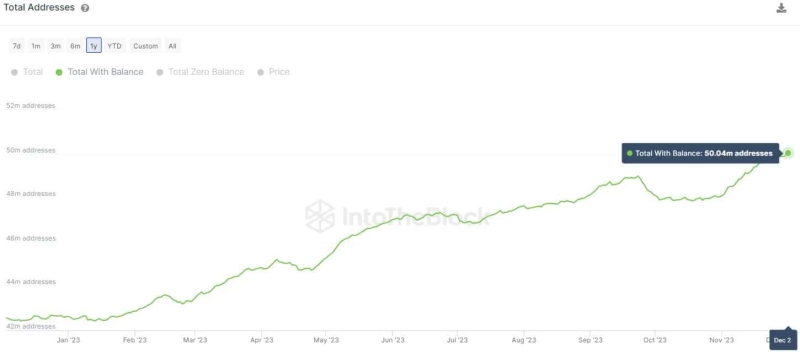
Bitcoin Wallets Surpass 50 Million as BTC Price Rally Fuels Growth

Source- Intotheblock
The Bitcoin (BTC) recovery surpassing the $40,000 psychological level has brought notable changes within its ecosystem, particularly in the growth of active wallets. Data from IntoTheBlock, a prominent on-chain data provider, reveals a significant increase in the number of Bitcoin wallets holding a balance. Surpassing the 50 million mark, this growth represents an impressive increase of over 17% since the year’s start, highlighting a rising interest and participation in the Bitcoin network.
- Bollinger band: An upswing in the upper boundary of the Bollinger band indicator reflects the buyers are currently having an upper hand.
- Vortex indicator. A bullish crossover state between the VI+(blue) and VI(-) pink indicates a recovery trend in action.

