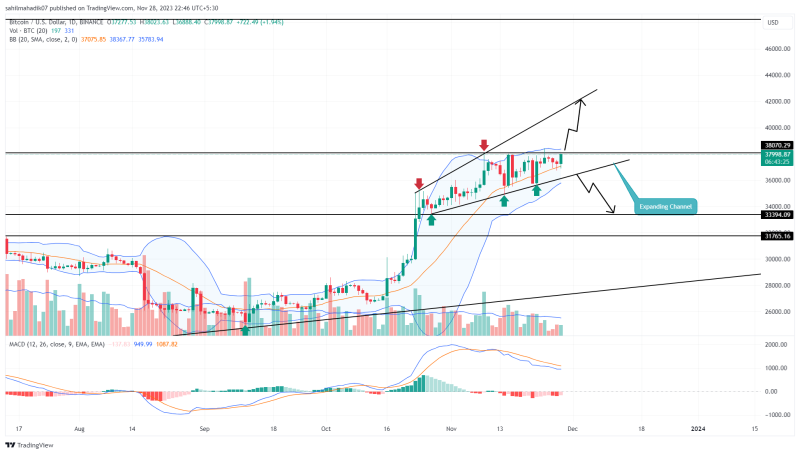
Bitcoin Price Prediction: The Bitcoin price recovery encountered a notable hurdle near the $38,000 mark, causing the trend to move sideways throughout the latter half of November. Over the past two weeks, the BTC price has made several unsuccessful attempts to breach this resistance, signaling a weakening in bullish momentum. However, an expanding channel pattern, which offers dynamic support to buyers, presents a potential avenue for lifting the coin from this period of uncertainty.
Also Read: Macro Guru Predicts Timeline For Bitcoin (BTC) Price Reaching $100K
Can $BTC Rise Above $40000?
- The $38000 stands as a high supply zone against buyers
- Until the expanding channel pattern is intact, the BTC price may continue the recovery trend
- The intraday trading volume in Bitcoin is $16.9 Billion, indicating an 8.12% loss.

Bitcoin Price Prediction | Tradingview
The crypto market has experienced heightened volatility in the past fortnight, triggered by developments related to the delayed Bitcoin spot ETF and legal issues surrounding Binance.
Consequently, the BTC price has struggled to surpass the $38,000 mark, resulting in a period of sideways movement. Nonetheless, amidst this consolidation, the coin price continues to adhere to the formation of an expanding channel pattern, which has guided a rally over the past five weeks.
The price is currently oscillating within the two diverging trendlines of this pattern, showcasing its substantial impact on market dynamics. Should the lower trendline’s dynamic support assist in a breakout above $38,000, buying pressure could surge, potentially propelling the recovery past the $40,000 mark.
Conversely, a breakdown below this support trendline might trigger a notable correction in the leading cryptocurrency.
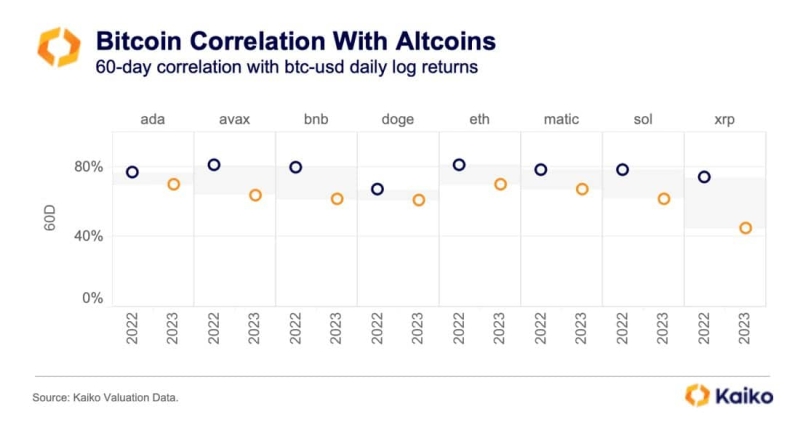
De-correlation Between Bitcoin and Altcoins

De-correlation Between Bitcoin and Altcoins | Kaiko
A well-known Crypto Analyst, CryptoBusy, recently highlighted in an ‘X’ post the de-correlation of Bitcoin with certain altcoins, using reliable market data from Kaiko. Over the last 60 days, Bitcoin has exhibited noticeable de-correlation with major altcoins, particularly XRP and BNB registering the largest drop, while DOGE and ADA experienced the least.
This de-correlation could likely stem from escalating uncertainty among crypto participants, influenced by significant events in November.
- Moving Average Convergence Divergence: The declining MACD and signal lines signal increasing bearish sentiment in the market.
- Bollinger Bands: The relatively flat upper boundary of the Bollinger Bands indicator serves as an additional barrier against buyers, suggesting potential resistance at higher price levels.

