BTC’s price briefly traded above $30,000 on 1 August as trading volume increased. While accumulation persisted at press time, it might not be enough.

- BTC exchanged hands briefly above $30,000 on 1 August.
- While accumulation remained underway, key momentum indicators revealed that it was weak.
A surge in Bitcoin [BTC] trading volume caused the leading coin to briefly trade across its $30,000 psychological price level during the intraday trading session on 1 August.
Read Bitcoin’s [BTC] Price Prediction 2023-2024
According to information from on-chain data provider Santiment, BTC’s trading volume rallied to a six-week high on 1 August. The uptick in trading volume was attributable to the re-entry of traders who had capitulated in the past few weeks when BTC’s value fell.
Should BTC holders expect more?
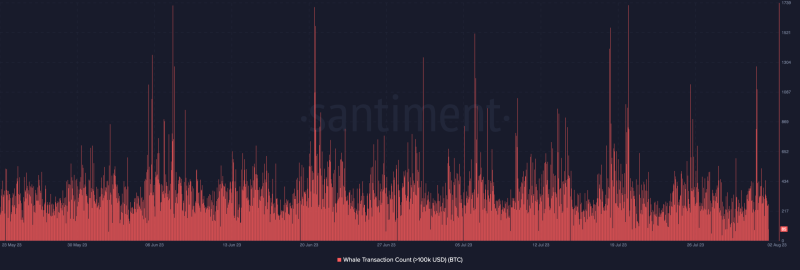
BTC whales took advantage of the coin’s momentary price uptick, data from Santiment showed. On-chain assessment of BTC whale trading activity in the past 24 hours revealed a surge in the count of whale transactions that exceeded $100,000.
Per Santiment, BTC recorded 10,050 transactions worth over $100,000 on 1 August. This represented the highest daily count since 26 July.

A corresponding increase in whale transactions count when an asset’s price rallies is seen as a bullish signal, as a sustained rally in whale transactions can help drive up the value of that asset.
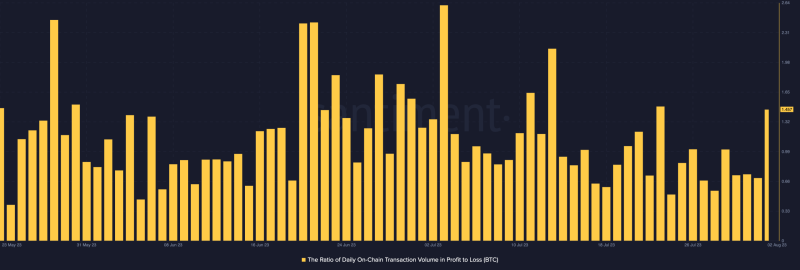
Also, the ratio of BTC transaction volume in profit to loss climbed to its daily highest level since 24 July. At press time, this stood at 1.457, suggesting that BTC holders booked more gains on their transactions than they did losses.

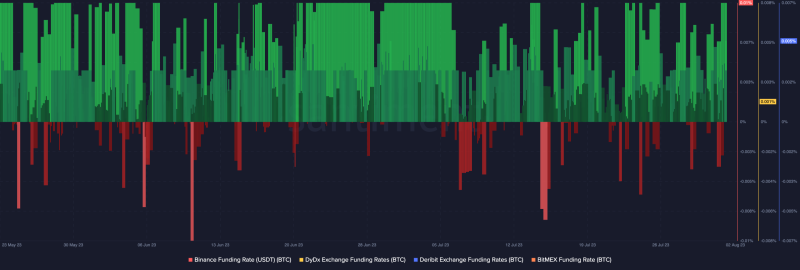
Furthermore, the coin’s funding rates across exchanges remained positive. Positive BTC funding rates indicate that longs are paying shorts to maintain their positions. This is typically seen as a bullish signal, as it suggests that there is more buying pressure than selling pressure in the market.

Although BTC’s price has since fallen to $29,596 at press time, data from CoinMarketCap revealed a 2% uptick in its price in the last 24 hours.
How much are 1,10,100 BTCs today?
Continue to proceed with caution
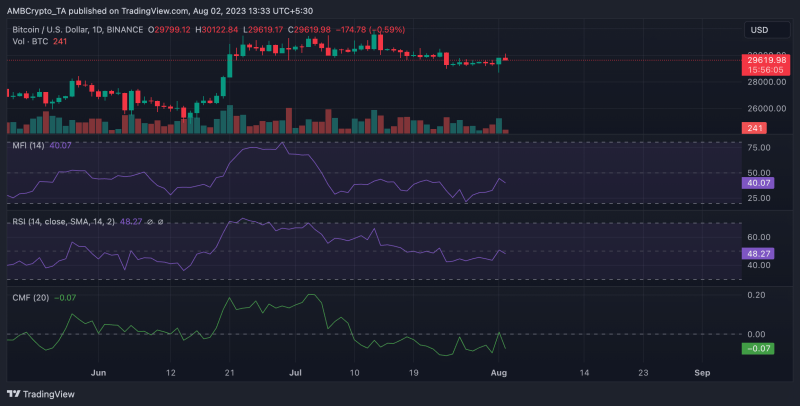
A look at BTC’s price movements on a 12-hour chart revealed that despite the brief jump in price, most daily traders remained cautious. While accumulation momentum pressure climbed, the positions of key momentum indicators suggested that it was not strong enough.
At press time, the coin’s Relative Strength Index (RSI) rested below its center line at 48.27. Likewise, its Money Flow Index (MFI) was 40.07. With a flatness observed in these indicators at the time of writing, no further price growth can be supported by the ongoing accumulation.


