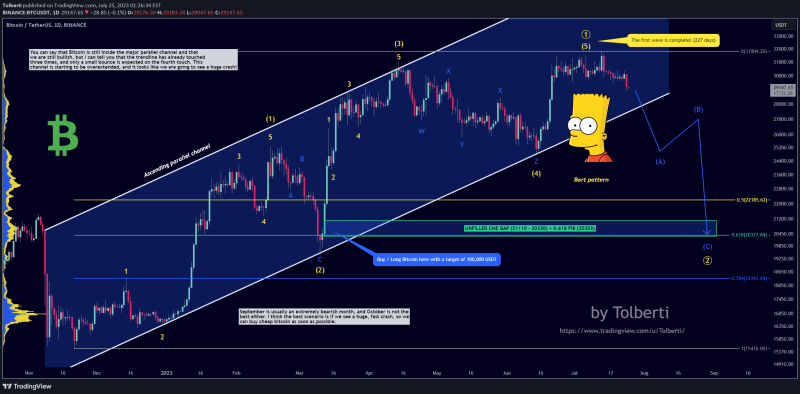
- The Bart pattern is now confirmed, and it doesn’t look good at all for the price of Bitcoin! We need to react to the recent price action, and this pattern is breaking down. I would not be surprised if we woke up in the morning and saw a big red dildo!
- You can say that Bitcoin is still inside the major parallel channel and that we are still bullish, but I can tell you that the trendline has already touched three times, and only a small bounce is expected on the fourth touch. This channel is starting to be overextended, and it looks like we are going to see a huge crash!
- This analysis is not a trade setup; there is no stop-loss, entry point, profit target, expected duration of the trade, risk-to-reward ratio, or timing. I share my trades transparently and post trade setups privately.
- My target is still 21K, as you already know. I am not buying any BTC for the long term until we reach this target. It’s a strong support because of the 0.618 Fibonacci retracement and the unfilled CME futures gap.
- September is usually an extremely bearish month, and October is not the best either. I think the best scenario is if we see a huge, fast crash, so we can buy cheap bitcoin as soon as possible.
- As per my Elliott Wave analysis, a huge major impulse wave (1) has been completed, and we are looking for an ABC correction. Markets, especially Bitcoin, move in clear waves, and this theory is pretty good for it.
- I warned you about this Bart pattern in my previous analysis, saying that it’s a very possible scenario. This was definitely a good idea, and now the price is going down.
- I am now bearish on Bitcoin and expect lower prices. Let me know in the comment section what you think!
- Thank you, and for more ideas, hit “Like” and “Follow”!
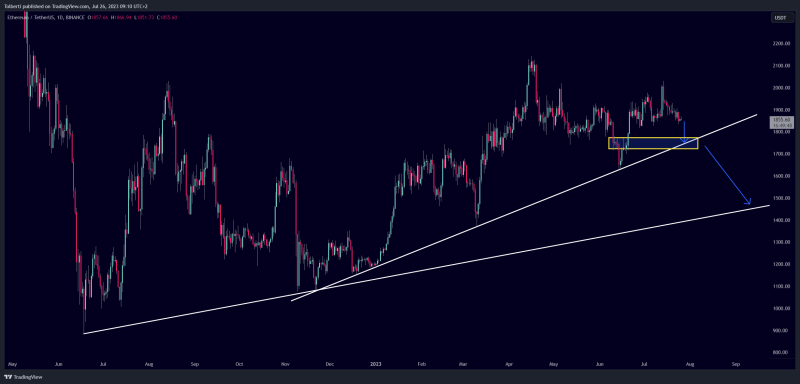
Comment: I hope you are prepared on what is coming! ETH needs to go down as well to fill the GAP and test the previous Head and Shoulders pattern.


